- Getting Started!
- Building EX Surveys
- EX Metrics
- EX Dashboard
- EX Dashboard Settings
- Analyze your drivers
- Good to know
- Getting Started!
- Why Sogolytics
- Creation of Basic and Trial Accounts
- Creation of Paid Accounts
- Home Tab Tour
- Design Tab Tour
- Track Tab Tour
- Distribute Tab Tour
- Report Tab Tour
- Utilities
- Resource Hub
- Organizing Projects in Folders
- Intro to Premium Plan
- Intro to Pro Plan
- Intro to Free Trial Accounts
- Introduction to Free Basic Accounts
- Intro to Plus Plan
- Student, Academic, and Nonprofit Discounts
- Help Me Choose!
- Recent Projects
- Welcome Home
- All Projects
- Help Center
- Getting Started with Sogolytics
- Verify My Account
- Data Tab Tour
- Mobile App
- Design
- Question Types
- Add a Question
- Mobile Friendly Questions
- Introduction to Project Design
- Create a Project
- Re-use Questions and Answers
- Edit a Question
- Introduction to Simple Question Types
- Introduction to Grid Questions
- Horizontal Radio Button
- Question Bank
- Answer Library
- Import in Bulk
- Project Logic
- Single-Question Branching
- Multi-Question Branching
- Question Display Logic
- Answer Display Logic
- Advanced Design Options
- Piping
- Data Population
- Quota Management
- Link Responses to Directory
- Survey Page Actions
- Page Actions
- End and Exit on a Specific Page
- Bulk Actions
- Preview Page
- Project Tools
- Text & Translations
- Spell Check
- Find and Replace
- Rearrange Questions
- Question Sequence
- Preview Survey
- Introduction to Project Options
- Project Details
- Add Languages
- Anonymous Project
- Display Options
- Event Messages
- Save and Continue Later
- Thank You Message
- Reopen Submitted Responses
- URL Redirect: Static and Dynamic
- Print Options
- Expiry Rules
- Automatic Email Alerts
- Rules and Alerts
- Instant Thanks
- Question Features
- Formatting Questions
- Question Hint
- Mandatory Response
- Encouraged Response
- Answer Sequence
- Rearranging Answers
- Column Display
- Answer Option Sorting
- Question Tools
- Adding Images and Multimedia
- Bulk Actions
- Depositing to Question Bank
- Survey Branding
- Custom Survey URLs
- Custom Report URLs
- Add a Logo
- Introduction to Project Customization
- Customize Labels and Text
- Customize Project Style in Visual Settings
- Display Width
- Mobile Display Themes
- Hide Answer Options
- Edit an Active Survey
- Accessibility
- Copying Projects Between Accounts
- Download Project
- File Library
- Survey Design Pitfalls
- Build a Form
- Create with AI
- Use Template Bank
- International Survey Questions
- Project Types
- Switch Project Type
- Use Chain Invitations to Share Surveys
- IntelliMatrix
- Display Mode
- Enhanced Participation
- Descriptive Text
- Text Box
- Radio Button (Single-Select)
- Drop Down
- Check Box (Multi-Select)
- Demographic
- Rating Scale
- Symbol Rating Scale
- Like/Dislike
- Ranking
- Date
- Image Choice
- Net Promoter Score (NPS)
- Multiple Text Box
- Multiple Drop Down
- Radio Grid
- Check Box Grid
- Rating Radio Grid
- Rating Drop Down Grid
- Rating Scale Grid
- Matrix Grid
- Advanced Questions and Elements
- Page Break
- Captcha
- List Box
- Rating Drop Down
- Rating Radio Button
- Attachment
- Numeric Allocation
- Drill-Down
- Signature
- Answer Recommendations
- Distribute
- Directory
- Build Directory Using A File
- Build Directory Using External Sources
- Build Directory Using Project Responses
- Manage Directory
- Introduction to Activities
- Automation in Directory
- Creating Activities using a File
- Creating Activities using Project Responses
- Creating Activities using External Sources
- Introduction to Directories
- Participation
- Track
- Report
- Introduction
- Run a Report
- Verbatim: Open-Ended Text Analysis
- Response Table: Tabular Display of Responses
- Comparison: Compare Data Sets
- Frequency Table: Response Counts
- Statistical: Numeric Calculations
- Response Trend: Participation Over Time
- Response Rate: Participation By Group
- Attachment: Download Participant Files
- Advanced Frequency: Data Dive
- Segmentation Report: Divided Data
- Ballot Box Stuffing Report
- Omni All in One Report
- Display Options in Omni
- Applying Filters in Omni
- Overall Report Settings
- Survey Metadata
- Customize Card View
- Build Your Canvas
- Export Report and Canvas
- Individual Responses
- Mark Incomplete Responses Complete
- Exclude Response From Reports
- Export Individual Responses
- Edit Responses – Data Cleaning
- Charts and Graphs
- Customizing Charts
- Download/Export Charts
- Save, Export, Share Reports
- Save and Generate Reports
- Modify and Delete Reports
- Download Reports
- Email Dynamic Reports
- Share Reports
- Filter Manager
- Applying Filters
- Creating Filters
- Select Required Questions
- Download Formats Supported
- Net Promoter Score in Reports
- Calculating Averages
- Percent Doesn’t Add to 100%
- Merge Projects
- Save, Share and Slideshow
- Text Analysis: Measure Response Sentiment
- Engagement Report: Measure Engagement Scale
- Applying Segmentation to Questions in Omni
- Score in Omni
- Dimensional Analysis Report
- Cross Tabs in Omni
- Custom Dashboard
- Introduction to Widgets
- How to add a Widget?
- Graph Widget
- Table Widget
- Open-ended Responses Widget
- Description Widget
- Segmentation in Custom Dashboard
- Add Multiple Widgets
- Score Widget
- Dashboard Options
- Layout Settings
- Widget Settings
- Share Your Custom Dashboard
- How to Build a Custom Dashboard?
- Custom Dashboard Overview
- Filters in Custom Dashboard
- Introduction to Custom Dashboard
- Data & Security
- Import Options
- Import Offline Responses
- Import Sogolytics1 Format
- Export Automation
- Export Data
- Export Formats
- Export Data to SPSS
- Sogolytics1 Format for Import
- Export to MS Excel
- How do I exercise my GDPR rights?
- Right to Rectification
- Right to Erasure
- Right to Access your Data
- Rights for Participants
- Cookie Policy
- HIPAA Compliance
- HIPAA Features
- Enabling HIPAA Features
- Downgrading
- HIPAA Security Tips
- Integrations and API
- Google Analytics
- Overview
- Connect to Salesforce
- Push Data into Salesforce
- Create Contact Lists From Salesforce
- Good to Know
- API
- Zapier Integration
- Introduction to Automated Distribution
- Connect to Sogolytics SFTP server
- Create SFTP Folders and Files
- HTTP Targets
- Email to Invitation
- Add SFTP Folders and Files
- Connect to Sogolytics SFTP server
- Automated Distribution
- Dynamic Contact Lists: Google Drive
- Dynamic Contact Lists: OneDrive
- Dynamic Contact Lists: SFTP
- Account Administration
- Account Settings
- Update Personal Information
- Update Company Information
- Account Notifications
- Review Account Usage
- Sender Domain Authentication
- Customize Survey Labels
- Project Allocation
- Linked Account
- View Product Details
- Referral Program
- Payment History
- Billing Information
- Log Out From Sogolytics
- Your Account Logo
- YourCompany.com Survey URL
- Safelisting
- Introduction to User Management
- Adding Sub-Users
- User Management
- Workflow Management
- Project Calendar
- Know Your Limits
- Two-Step Authentication
- Account Security
- Survey Branding
- Good to Know
- Recent Account Activity
- Single Sign-On (SSO)
- Email Address Verification
- Use Your Mail Server
- Outbound Email Settings
- Dedicated Email Server
- Compliance
- DMARC Policy
- Billing
- Introduction
- Acceptable Payment Methods
- Upgrade a Paid Account
- Freeze Account
- Cancel Account
- Consider Before You Cancel
- Payment Receipts
- Change Billing Information
- Upgrade Using Purchase Order
- Referral Benefits Program
- Sogolytics Plans
- Payment Methods Available
- Failed Payment
- Switch to Annual Billing
- Upgrade a Basic/Trial Account
- Sign Up for a Paid Account
- Sogolytics Standard Support
- Downgrade or Cancel Account
- Poll Project
- Good to Know
- FAQs
- Getting Started!
- Building CX Surveys
- CX Metrics
- CX Dashboard
- CX Dashboard Settings
- Analyze your drivers
- Good to know
- Getting Started
- Account Set-up
- Account Administration
- Introduction to Account Administration
- Adding Users
- Edit User Information
- Permission Levels
- Add a User Group
- Edit a User Group
- Notes on User Groups
- Delete a User Group
- Building Landing Pages
- Enable Search on Landing Pages
- Where to Find Embed Codes for Landing Pages
- Tab Editor
- Customer Feedback Preferences
- Forward Your Emails into SogoConnect
- Email Forwarding and Monitoring Team
- Authenticate Email Domain
- Account Activity Log
- Define Dialogue Aging
- Create Tags in SoGoConnect
- Comparison in SogoConnect
- Raise a Dialogue
- Safelisting in SoGoConnect
- Critical Alerts: Set up Teams and Keywords
- Enable Browser-Based Notifications
- Critical Alerts
- Inbox
- Dialogues
- News
- SogoConnect Dashboard
- Campaigns
- Help
- Getting Started!
- Assessment Question types
- Score and more
- Quiz participation
- Get Results
Identifying and measuring EX metrics along the employee journey offers you insights on how employees’ experiences vary at each stage. If you discover that employees are especially satisfied with their employee service interactions but not as happy with their training experiences, for example, you have an opportunity to learn what’s working well and apply lessons learned.
On the EX Dashboard, you can select and compare Tags. Here’s how:
By default, all Tag Categories will be available as default tabs under Comparison. Each Tag Category tab will further display comparison between its constituent Tags.
You can drag and rearrange your Tag categories and custom comparisons.
Under each comparison tab you’ll see the following widgets:
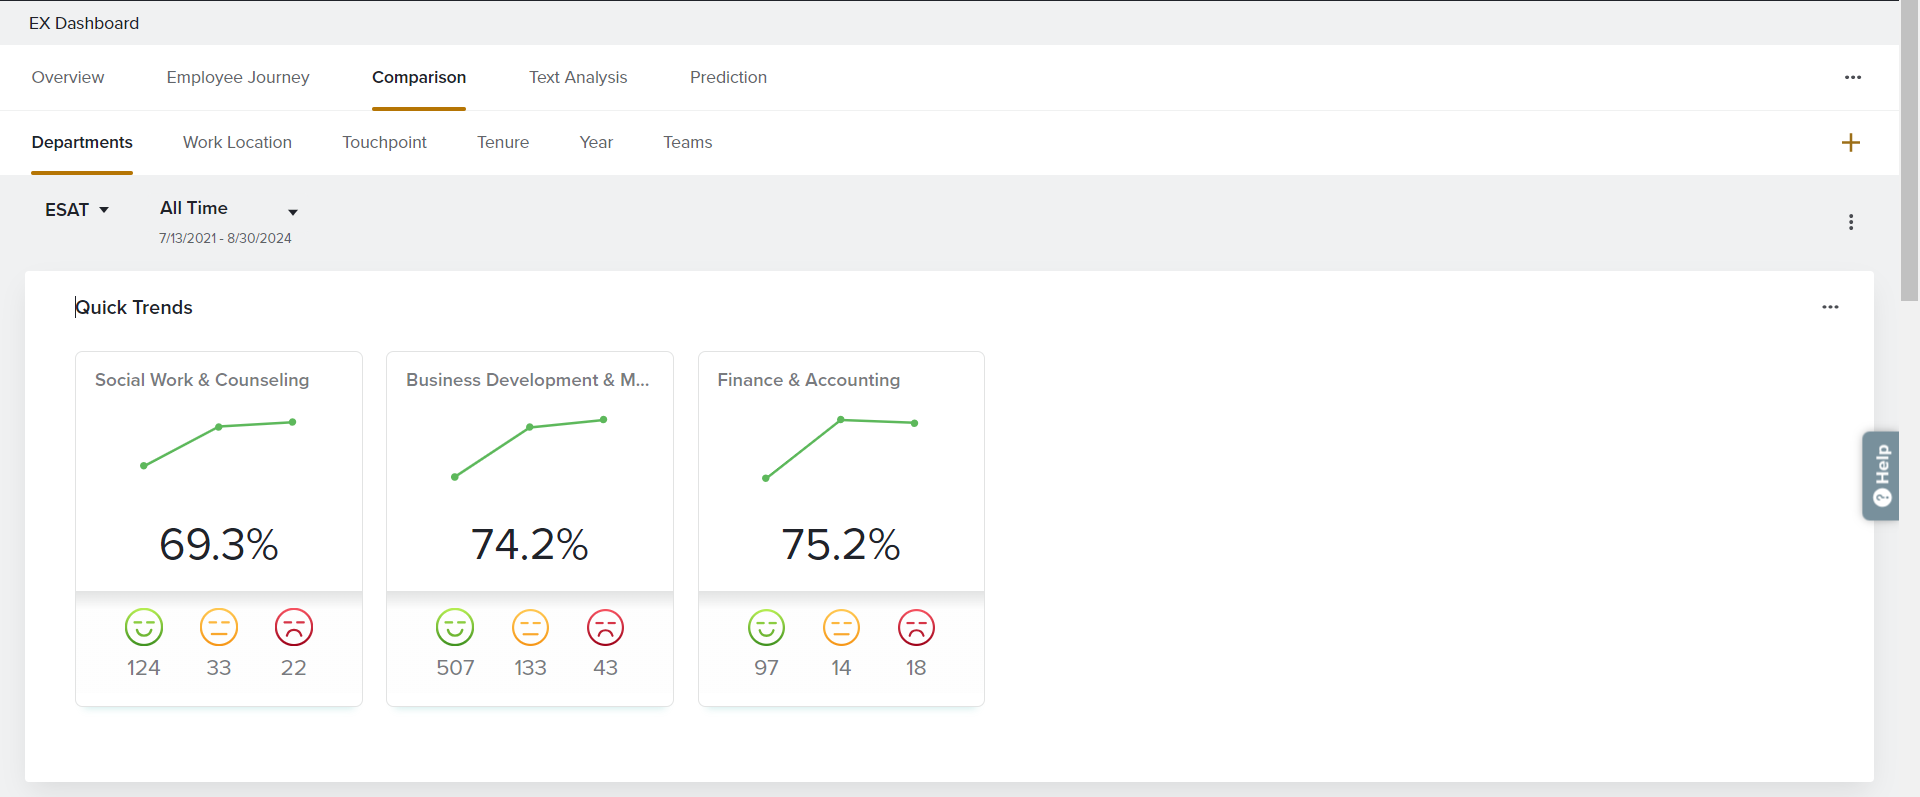
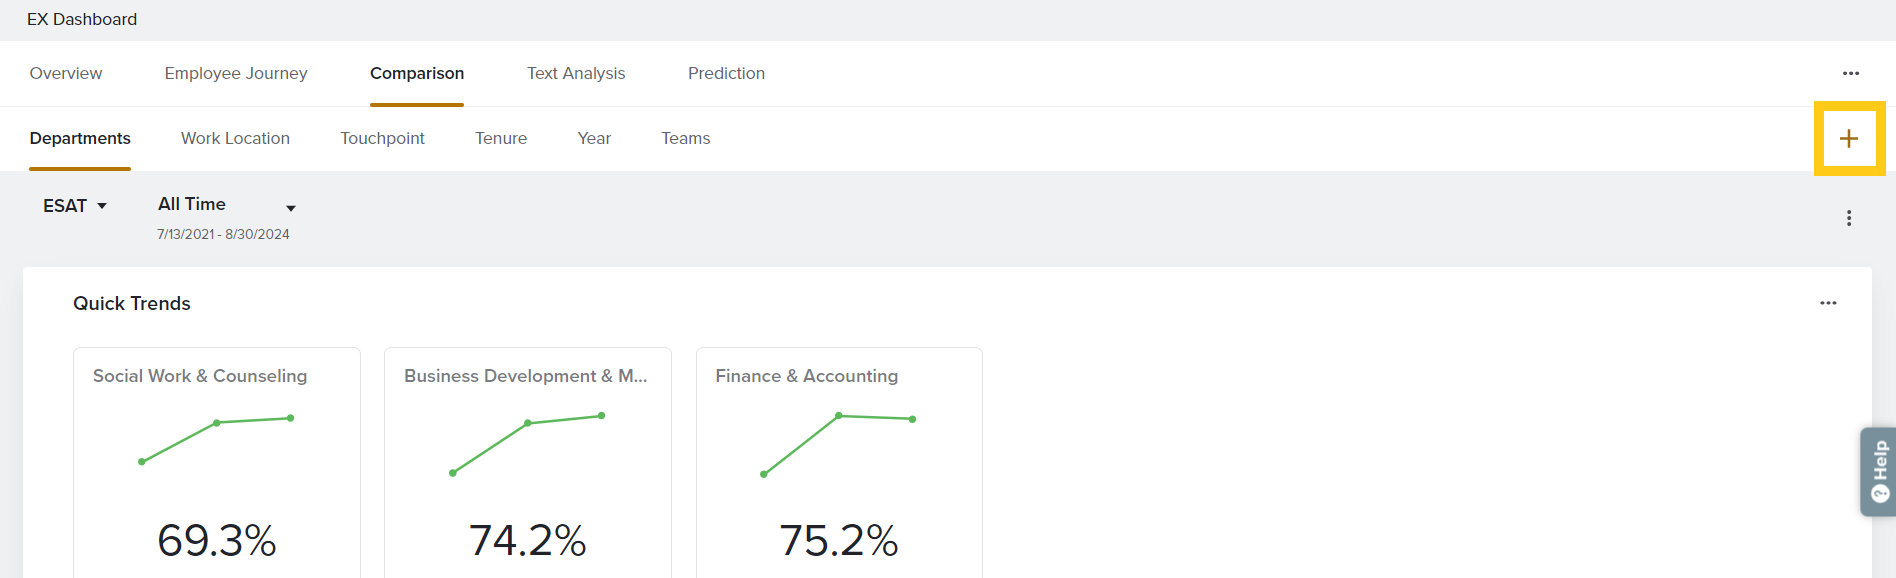
- Quick Trends: Displays trend for each category while showing response distribution across positive, neutral, and negative. If you have more than 4 Tags and more than 10 responses received for each Tag, the strongest and weakest Tags will be highlighted.
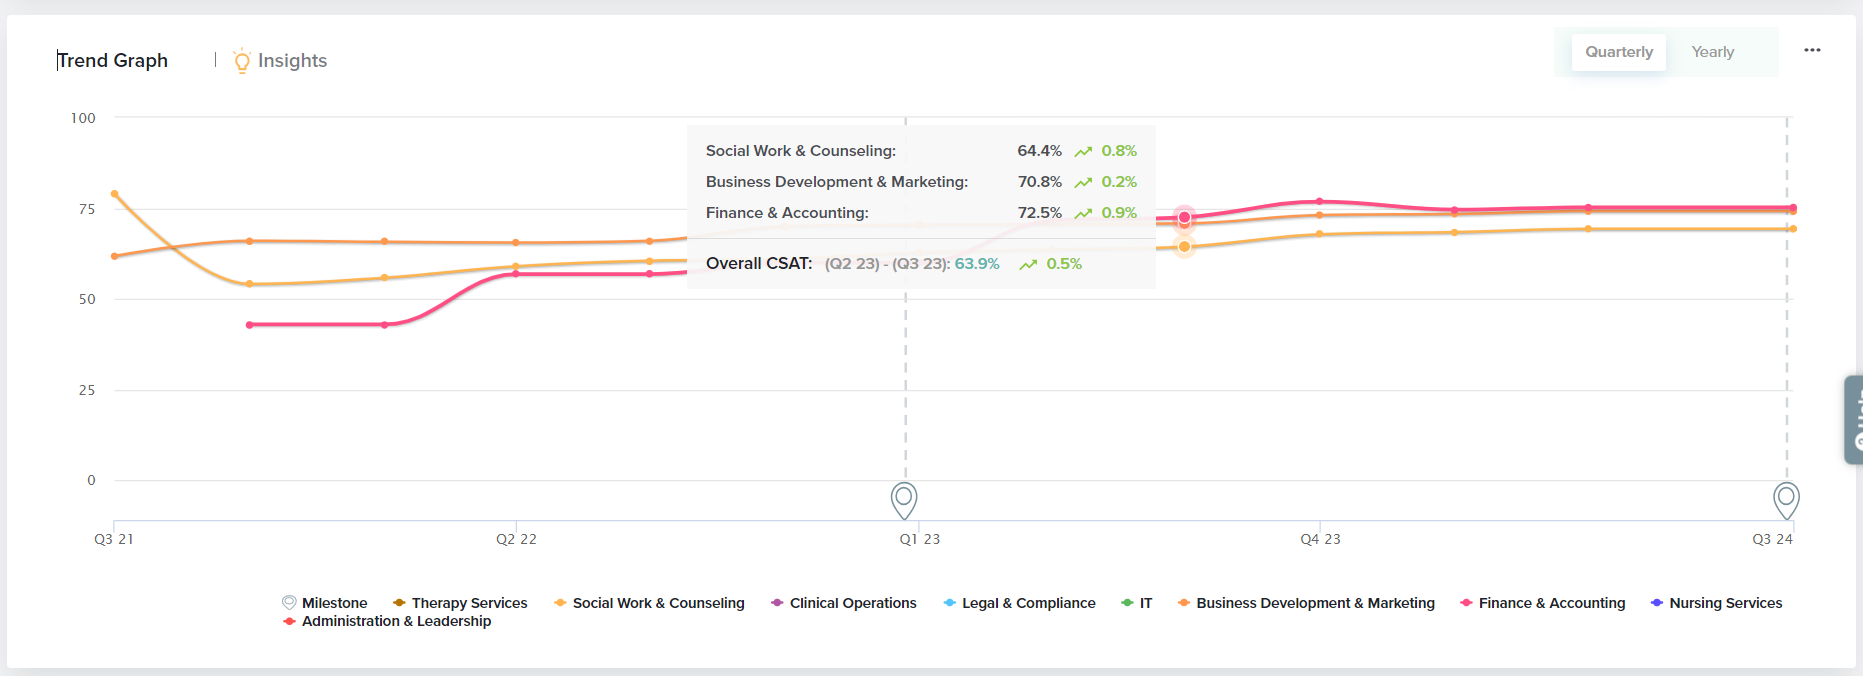
- Trend Graph: View the trend graph of a metrics for each Tag under a category over time.
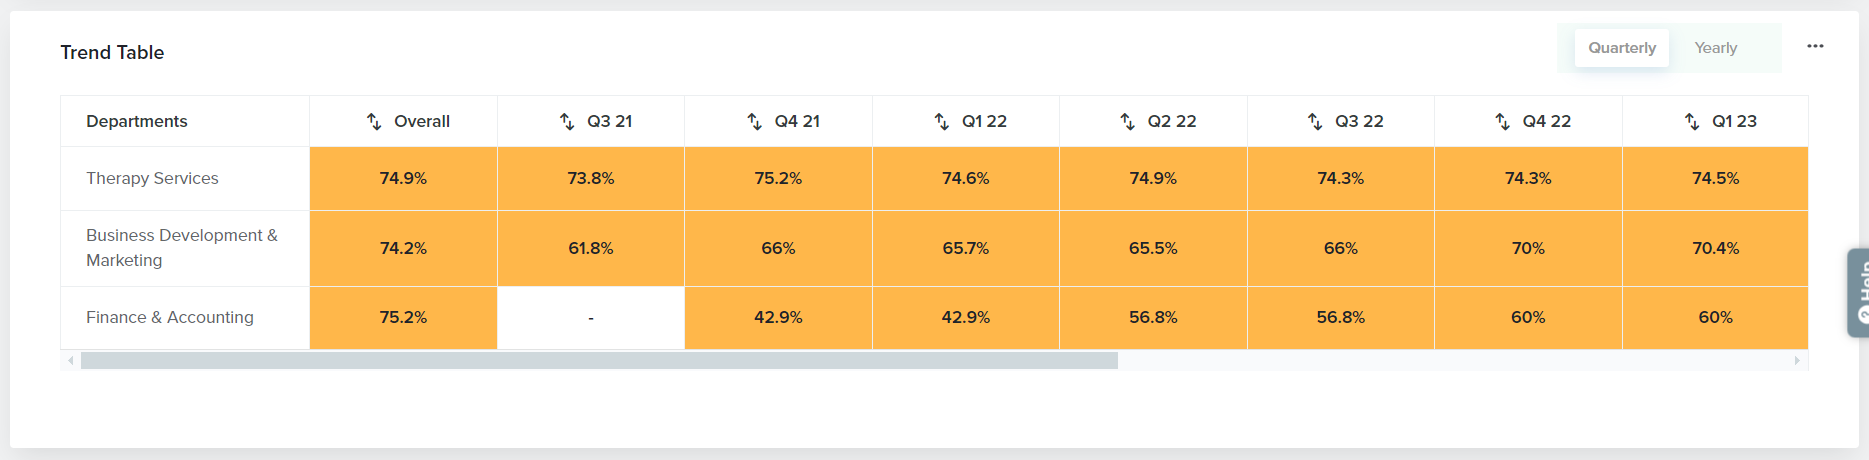
- Trend Table: View the trend of each tag, based on the selected metric within a table.
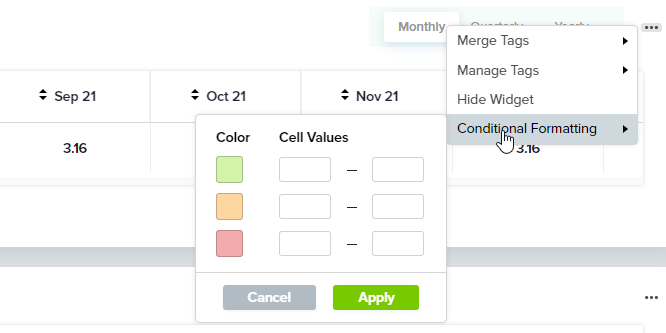
For Custom Metrics you can choose to define color range using Conditional Formatting.
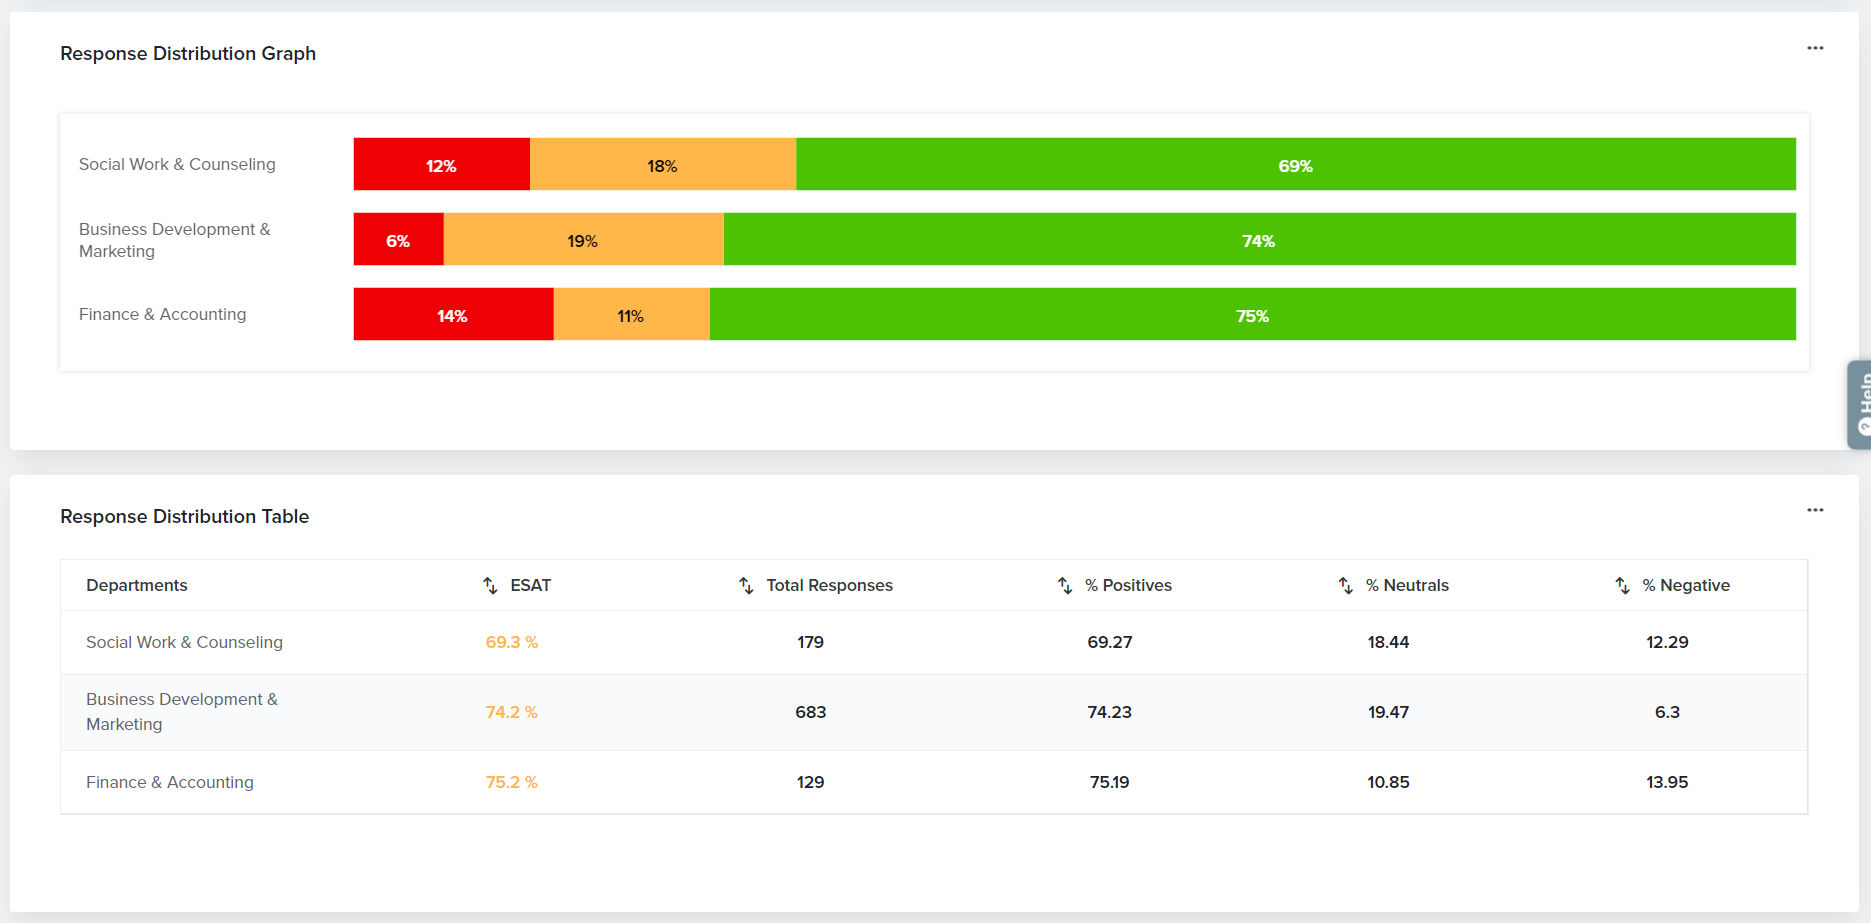
- Response Distribution Graph: View your responses divided into sentiment categories in a stacked bar graph format.
- Response Distribution Table: View responses divided into sentiment categories in a table format
- As needed, customize these widgets through the following options:
- Scale Range: Choose to display default score range (eg: -100 to 100 for eNPS) or Best Fit. (Only for Trend Graph)
- Set Metric Goal: Set a goal for your metric so can easily review how close you are to your goal.
- Merge: Combine Tags and view their merged data as a single element on the widgets.
- Hide: Do not display a certain Tag on the Dashboard.
- Options: For Custom Metrics, define which values should be displayed as positive, neutral, and negative within the Dashboard widget.
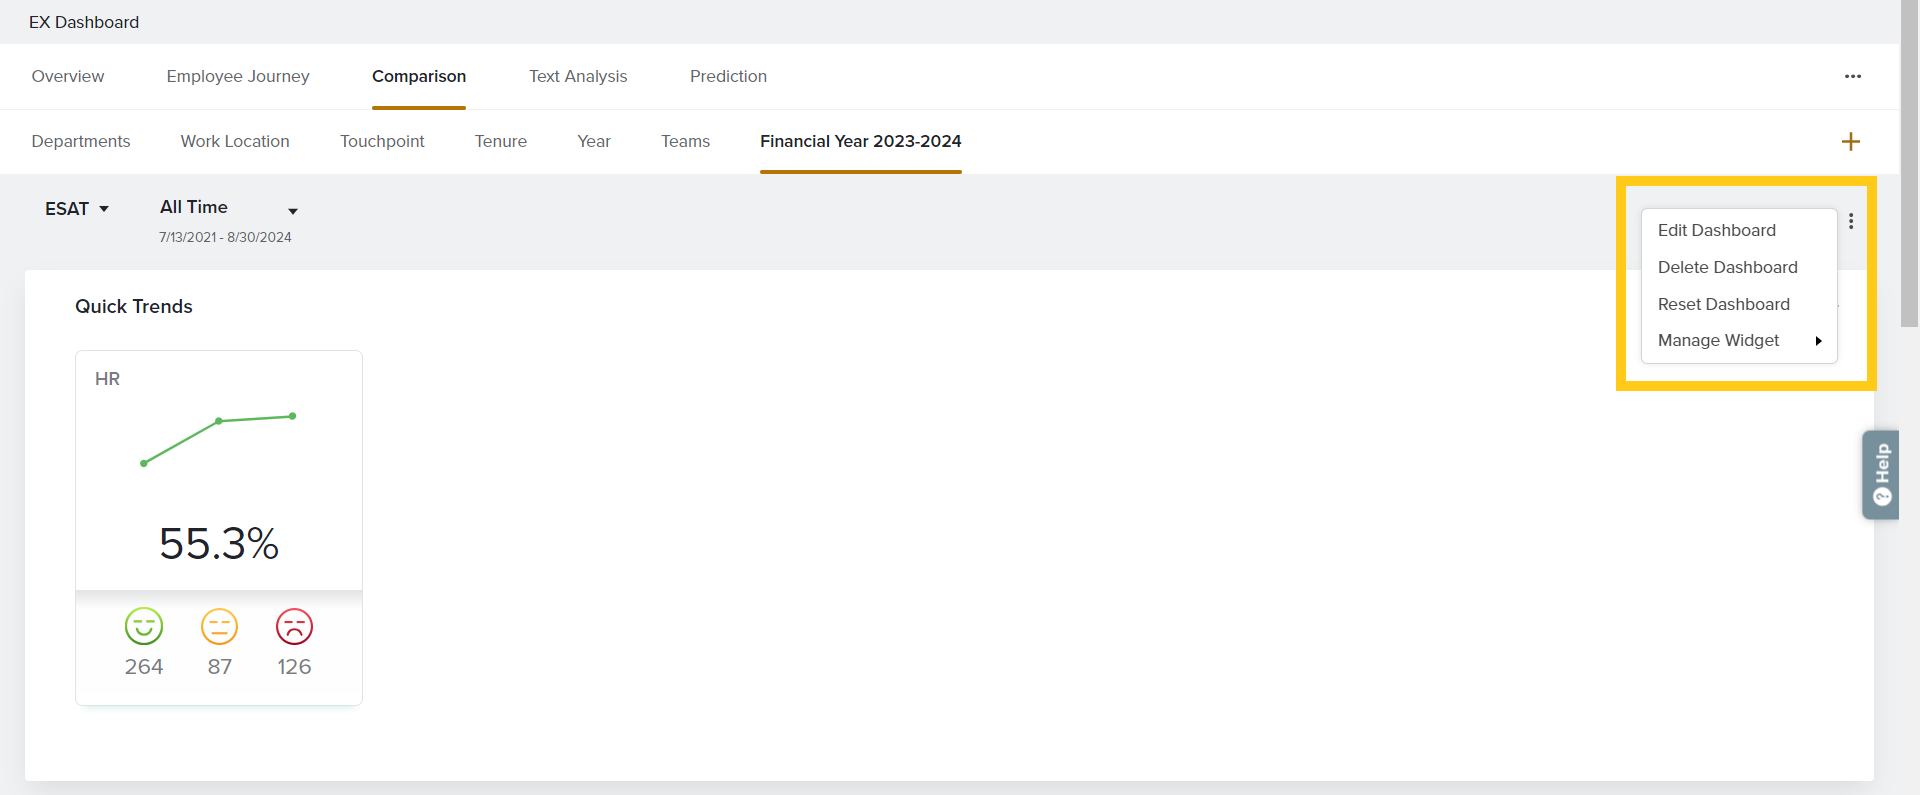
- Hide Widget: Each widget can be hidden from the Dashboard as needed. Unhide it from Manage Widgets under the three-dotted menu on the top band.
- Switch between different metrics and timelines from the top band.
Create Your Comparison Dashboard
Ready to create your own comparison dashboard with multiple data sets? Here’s how:
-
-
- Open the EX Dashboard.
- Click on the Comparison tab.
- Click on the plus icon in the right corner corner.
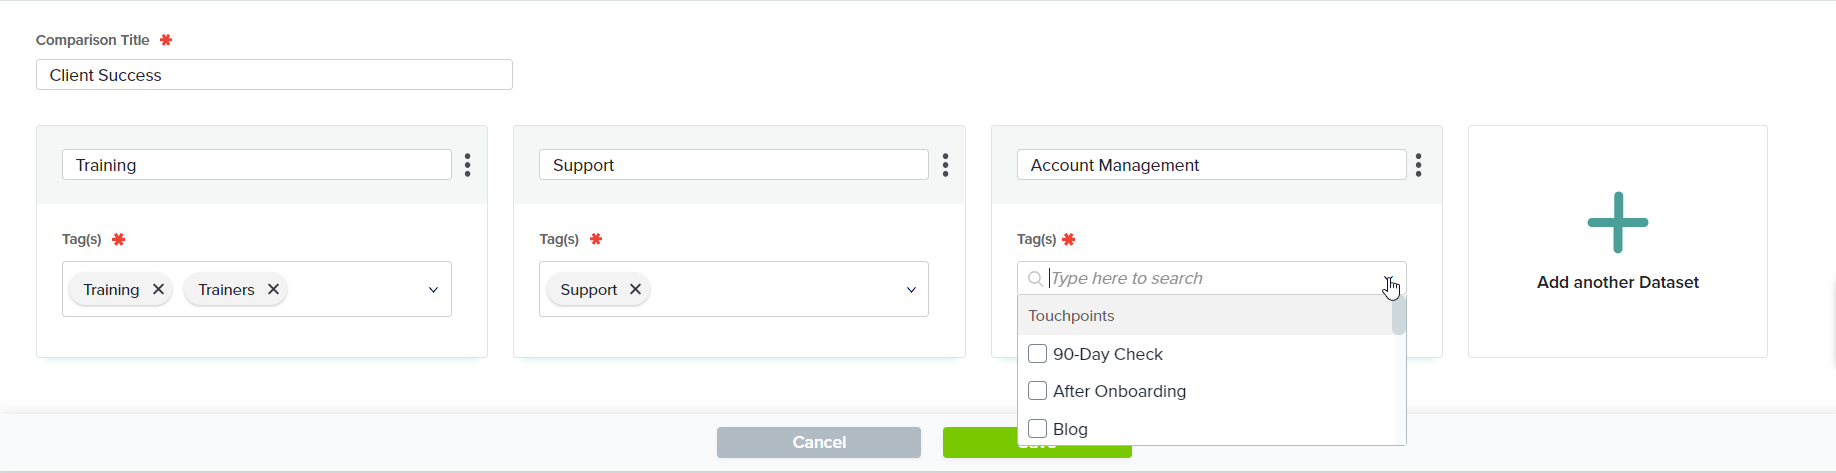
- Enter the title for your custom Comparison Dashboard view.
- Now, define each data set you’d like to compare. Enter the title and choose the Tags you’d like to include. A total of 10 data sets can be created.
- Save your changes.
- As needed, edit or delete this custom comparison by clicking on the three-dot menu in the top right corner.
-
Subscribe for tips and insights to drive better decisions!
