

Text Analysis: Measure Response Sentiment
Reviewing every single open-ended response offers plenty of informative insights, but it can also be very time consuming. If you have a large number of responses and want to get a faster look at some common points and sentiments, Text Analysis can help.
With both a Word Cloud and easy to understand graphs and tables, this report delivers powerful results in a fraction of the time you’d need to read every comment. Examine common topics, then drill down on positive, neutral, and negative content so you can better understand the important takeaways.
Navigate to
Here’s how:
- Select your project and click on Report.
- From the Report menu bar, choose Text Analysis.
- Select the questions that need to be analyzed, then choose whether or not to include incomplete responses.
- Click Generate Now to prepare your data for the report. The time required to prepare your data will vary based on the number of responses collected. While the data is prepared for analysis, you may utilize other platform features.
- Review and drill down on results displayed.
Overall Metrics
Across the top, you’ll see cards with the following metrics:
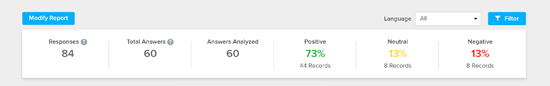
- Responses
- Total Answers
- Answers Analyzed
- Positive Responses
- Negative Responses
- Neutral Responses
Limits are applied to the total number of answers that can be analyzed. If you’d like to purchase additional analysis power, contact your Account Manager.
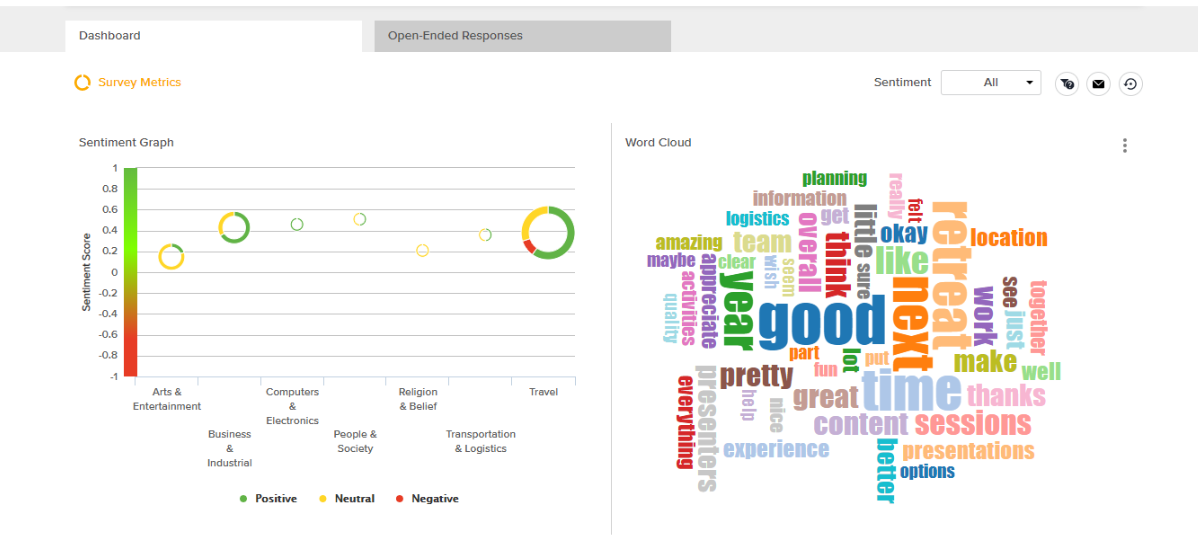
Dashboard
The Dashboard includes multiple elements that allow you to see an overall overview, a breakdown by topic, and a closer look at relevant responses.
Report-Level Options
- Review overall metrics from the bar across the top of the report.
- For a closer look at certain segments of your data, click the Filter button on the top right to create or apply a filter.
- If your project is multilingual, choose to filter records for a single language or multiple languages.
- To include or exclude selected open-ended questions, click on the Modify filter icon on the top left corner of the page.
Dashboard-Level Options
- To review responses by question or by sentiment, make selections from the top right of the Dashboard.
- To email your Dashboard, click on the email icon.
- To reset all filters, click on the reset icon.
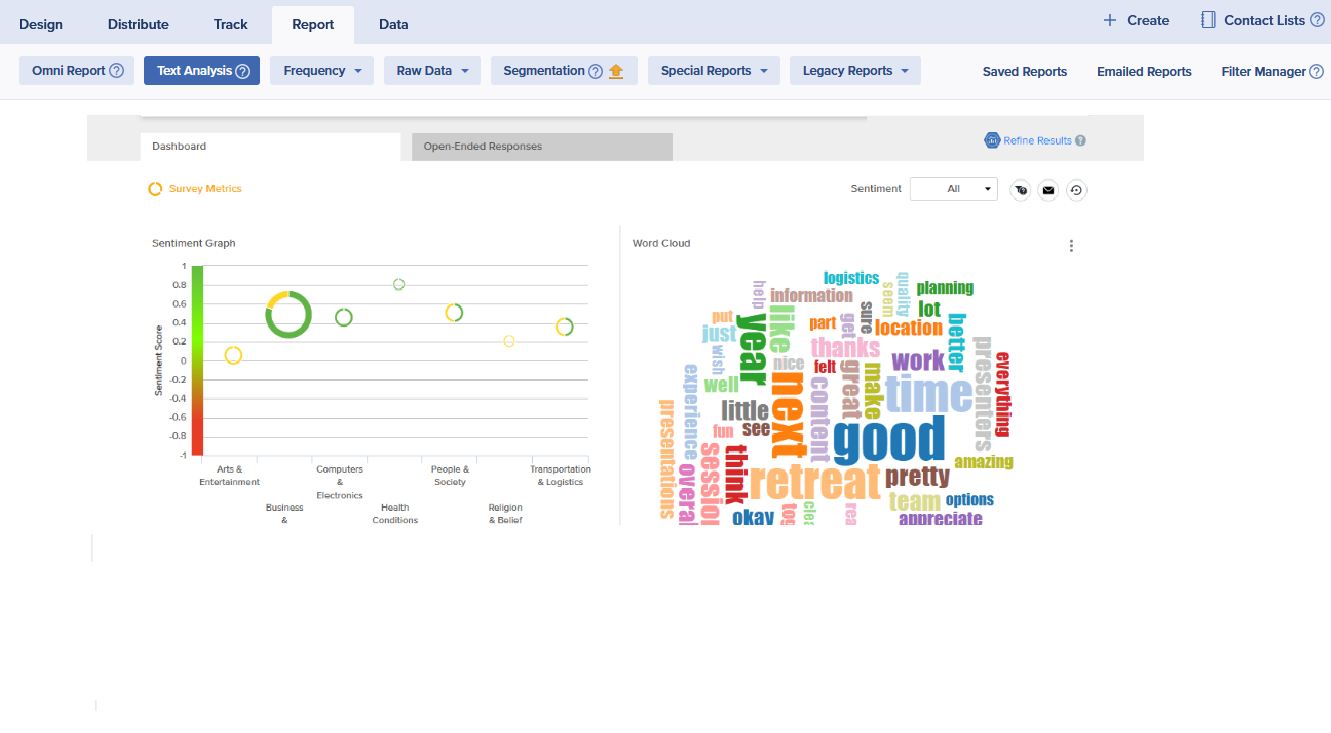
Sentiment Graph:
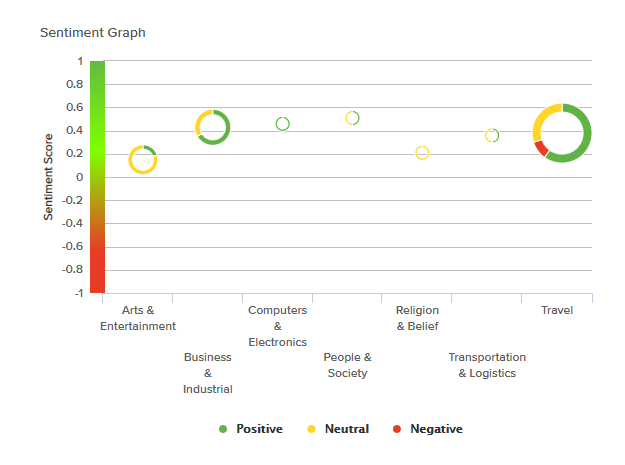
This graph categorizes all responses into topics.
- Hover over each topic’s donut chart to see:
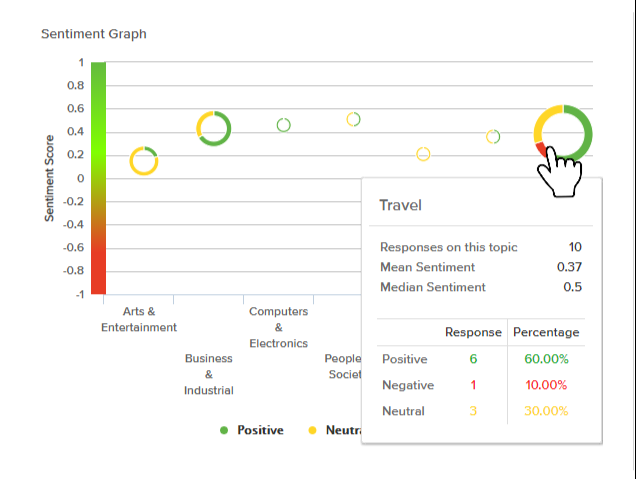
- Number of responses categorized within this topic
- Mean Sentiment
- Median Sentiment
- Number and percentage of positive responses
- Number and percentage of negative responses
- Number and percentage of neutral responses
- Click on the donut chart to see the complete set of responses for the chosen topic.
A maximum of 7 topics will be displayed.
- To see an overview by category, click Show Graph.
- Within the search box on the left, enter keywords to look for something specific.
- To filter topic, or sentiment, click on the column title and choose from the dropdown menu.
- To change the sentiment of a specific response, click on the icon next to the sentiment and select from the dropdown options.
- Click on the download icon to export all or filtered open-ended responses.
- Reset any filters applied by clicking on the reset icon on the far right.
- Chinese (Simplified)
- Chinese (Traditional)
- English
- English (UK)
- French
- German
- Italian
- Japanese
- Korean
- Portuguese (Brazilian)
- Portuguese (Continental)
- Spanish
Word Cloud
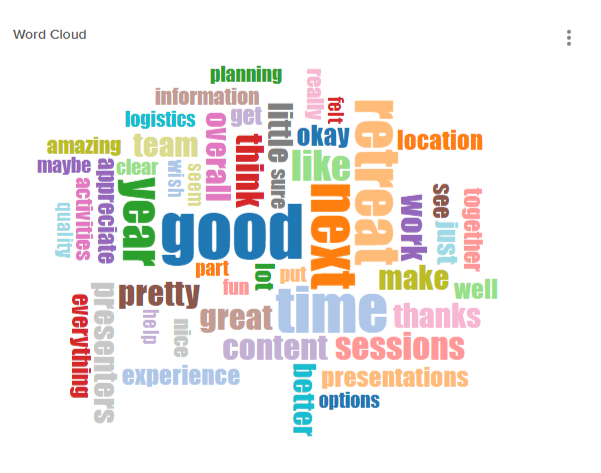
You’ll see a visual representation of text responses that highlight terms based on their frequency of use. Larger words indicate a higher frequency of use. Customize your word cloud by clicking on the three-dot icon.
Open-Ended Responses
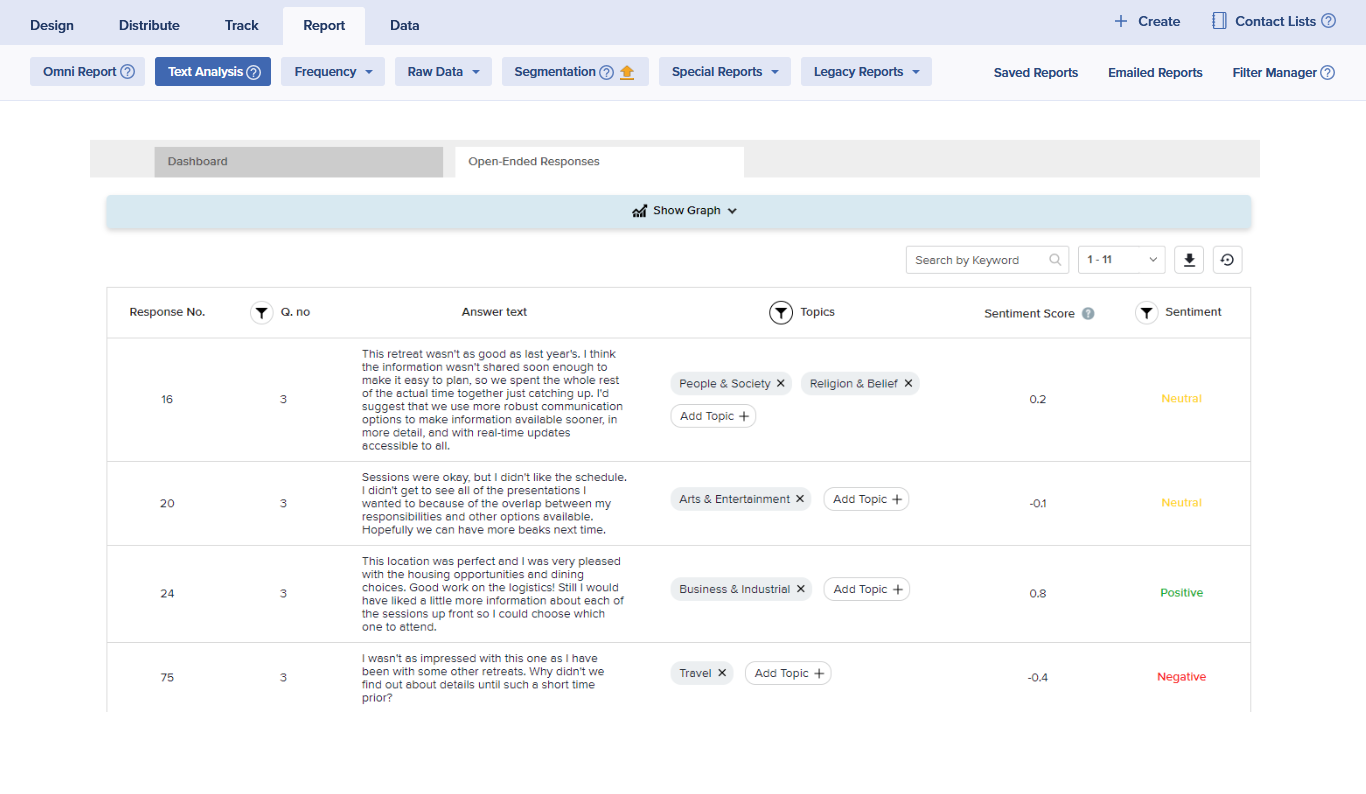
Click the Open-Ended Responses tab to review the full text and details of each response.
Multilingual Analysis
When you reach out to a wide audience, it’s important to understand everyone’s feedback. Get the bigger picture by analyzing responses received in multiple languages.
The Textual Analysis Report currently supports analysis of responses in these languages:
Refine Results
To improve the relevance of your results and provide deeper industry-specific insights, consider a custom Text Analysis model. Click on Refine Results on the top right corner for more details.
Text analysis is generated using Artificial Intelligence (AI) so it may lack nuance. However, users have the ability to edit topics and sentiment. We are continuously training the system to improve accuracy.
Subscribe for tips and insights to drive better decisions!