- Getting Started!
- Building EX Surveys
- EX Metrics
- EX Dashboard
- EX Dashboard Settings
- Analyze your drivers
- Good to know
- Getting Started!
- Why Sogolytics
- Creation of Basic and Trial Accounts
- Creation of Paid Accounts
- Home Tab Tour
- Design Tab Tour
- Track Tab Tour
- Distribute Tab Tour
- Report Tab Tour
- Utilities
- Resource Hub
- Organizing Projects in Folders
- Intro to Premium Plan
- Intro to Pro Plan
- Intro to Free Trial Accounts
- Introduction to Free Basic Accounts
- Intro to Plus Plan
- Student, Academic, and Nonprofit Discounts
- Help Me Choose!
- Recent Projects
- Welcome Home
- All Projects
- Help Center
- Getting Started with Sogolytics
- Verify My Account
- Data Tab Tour
- Mobile App
- Design
- Question Types
- Add a Question
- Mobile Friendly Questions
- Introduction to Project Design
- Create a Project
- Re-use Questions and Answers
- Edit a Question
- Introduction to Simple Question Types
- Introduction to Grid Questions
- Horizontal Radio Button
- Question Bank
- Answer Library
- Import in Bulk
- Project Logic
- Single-Question Branching
- Multi-Question Branching
- Question Display Logic
- Answer Display Logic
- Advanced Design Options
- Piping
- Data Population
- Quota Management
- Link Responses to Directory
- Survey Page Actions
- Page Actions
- End and Exit on a Specific Page
- Bulk Actions
- Preview Page
- Project Tools
- Text & Translations
- Spell Check
- Find and Replace
- Rearrange Questions
- Question Sequence
- Preview Survey
- Introduction to Project Options
- Project Details
- Add Languages
- Anonymous Project
- Display Options
- Event Messages
- Save and Continue Later
- Thank You Message
- Reopen Submitted Responses
- URL Redirect: Static and Dynamic
- Print Options
- Expiry Rules
- Automatic Email Alerts
- Rules and Alerts
- Instant Thanks
- Question Features
- Formatting Questions
- Question Hint
- Mandatory Response
- Encouraged Response
- Answer Sequence
- Rearranging Answers
- Column Display
- Answer Option Sorting
- Question Tools
- Adding Images and Multimedia
- Bulk Actions
- Depositing to Question Bank
- Survey Branding
- Custom Survey URLs
- Custom Report URLs
- Add a Logo
- Introduction to Project Customization
- Customize Labels and Text
- Customize Project Style in Visual Settings
- Display Width
- Mobile Display Themes
- Hide Answer Options
- Edit an Active Survey
- Accessibility
- Copying Projects Between Accounts
- Download Project
- File Library
- Survey Design Pitfalls
- Build a Form
- Create with AI
- Use Template Bank
- International Survey Questions
- Project Types
- Switch Project Type
- Use Chain Invitations to Share Surveys
- IntelliMatrix
- Display Mode
- Enhanced Participation
- Descriptive Text
- Text Box
- Radio Button (Single-Select)
- Drop Down
- Check Box (Multi-Select)
- Demographic
- Rating Scale
- Symbol Rating Scale
- Like/Dislike
- Ranking
- Date
- Image Choice
- Net Promoter Score (NPS)
- Multiple Text Box
- Multiple Drop Down
- Radio Grid
- Check Box Grid
- Rating Radio Grid
- Rating Drop Down Grid
- Rating Scale Grid
- Matrix Grid
- Advanced Questions and Elements
- Page Break
- Captcha
- List Box
- Rating Drop Down
- Rating Radio Button
- Attachment
- Numeric Allocation
- Drill-Down
- Signature
- Answer Recommendations
- Distribute
- Directory
- Build Directory Using A File
- Build Directory Using External Sources
- Build Directory Using Project Responses
- Manage Directory
- Automation in Directory
- Introduction to Activities
- Creating Activities using a File
- Creating Activities using Project Responses
- Creating Activities using External Sources
- Introduction to Directories
- Participation
- Track
- Report
- Introduction
- Run a Report
- Verbatim: Open-Ended Text Analysis
- Response Table: Tabular Display of Responses
- Comparison: Compare Data Sets
- Frequency Table: Response Counts
- Statistical: Numeric Calculations
- Response Trend: Participation Over Time
- Response Rate: Participation By Group
- Attachment: Download Participant Files
- Advanced Frequency: Data Dive
- Segmentation Report: Divided Data
- Ballot Box Stuffing Report
- Omni All in One Report
- Display Options in Omni
- Applying Filters in Omni
- Overall Report Settings
- Survey Metadata
- Customize Card View
- Build Your Canvas
- Export Report and Canvas
- Individual Responses
- Mark Incomplete Responses Complete
- Exclude Response From Reports
- Export Individual Responses
- Edit Responses – Data Cleaning
- Charts and Graphs
- Customizing Charts
- Download/Export Charts
- Save, Export, Share Reports
- Save and Generate Reports
- Modify and Delete Reports
- Download Reports
- Email Dynamic Reports
- Share Reports
- Filter Manager
- Applying Filters
- Creating Filters
- Select Required Questions
- Download Formats Supported
- Net Promoter Score in Reports
- Calculating Averages
- Percent Doesn’t Add to 100%
- Merge Projects
- Save, Share and Slideshow
- Text Analysis: Measure Response Sentiment
- Engagement Report: Measure Engagement Scale
- Applying Segmentation to Questions in Omni
- Score in Omni
- Dimensional Analysis Report
- Cross Tabs in Omni
- Custom Dashboard
- Introduction to Widgets
- How to add a Widget?
- Graph Widget
- Table Widget
- Open-ended Responses Widget
- Description Widget
- Segmentation in Custom Dashboard
- Add Multiple Widgets
- Score Widget
- Dashboard Options
- Layout Settings
- Widget Settings
- Share Your Custom Dashboard
- How to Build a Custom Dashboard?
- Custom Dashboard Overview
- Filters in Custom Dashboard
- Introduction to Custom Dashboard
- Data & Security
- Import Options
- Import Offline Responses
- Import Sogolytics1 Format
- Export Data
- Export Automation
- Export Formats
- Export Data to SPSS
- Sogolytics1 Format for Import
- Export to MS Excel
- How do I exercise my GDPR rights?
- Right to Rectification
- Right to Erasure
- Right to Access your Data
- Rights for Participants
- Cookie Policy
- HIPAA Compliance
- HIPAA Features
- Enabling HIPAA Features
- Downgrading
- HIPAA Security Tips
- Integrations and API
- Google Analytics
- Overview
- Connect to Salesforce
- Push Data into Salesforce
- Create Contact Lists From Salesforce
- Good to Know
- API
- Zapier Integration
- Introduction to Automated Distribution
- Connect to Sogolytics SFTP server
- Create SFTP Folders and Files
- HTTP Targets
- Email to Invitation
- Add SFTP Folders and Files
- Connect to Sogolytics SFTP server
- Automated Distribution
- Dynamic Contact Lists: Google Drive
- Dynamic Contact Lists: OneDrive
- Dynamic Contact Lists: SFTP
- Account Administration
- Account Settings
- Update Personal Information
- Update Company Information
- Account Notifications
- Review Account Usage
- Sender Domain Authentication
- Customize Survey Labels
- Project Allocation
- Linked Account
- View Product Details
- Referral Program
- Payment History
- Billing Information
- Log Out From Sogolytics
- Your Account Logo
- YourCompany.com Survey URL
- Safelisting
- Introduction to User Management
- Adding Sub-Users
- User Management
- Workflow Management
- Project Calendar
- Know Your Limits
- Two-Step Authentication
- Account Security
- Survey Branding
- Good to Know
- Recent Account Activity
- Single Sign-On (SSO)
- Email Address Verification
- Use Your Mail Server
- Outbound Email Settings
- Dedicated Email Server
- Compliance
- DMARC Policy
- Billing
- Introduction
- Acceptable Payment Methods
- Upgrade a Paid Account
- Freeze Account
- Cancel Account
- Consider Before You Cancel
- Payment Receipts
- Change Billing Information
- Upgrade Using Purchase Order
- Referral Benefits Program
- Sogolytics Plans
- Payment Methods Available
- Failed Payment
- Switch to Annual Billing
- Upgrade a Basic/Trial Account
- Sign Up for a Paid Account
- Sogolytics Standard Support
- Downgrade or Cancel Account
- Poll Project
- Good to Know
- FAQs
- Getting Started!
- Building CX Surveys
- CX Metrics
- CX Dashboard
- CX Dashboard Settings
- Analyze your drivers
- Good to know
- Getting Started
- Account Set-up
- Account Administration
- Introduction to Account Administration
- Adding Users
- Edit User Information
- Permission Levels
- Add a User Group
- Edit a User Group
- Notes on User Groups
- Delete a User Group
- Building Landing Pages
- Enable Search on Landing Pages
- Where to Find Embed Codes for Landing Pages
- Tab Editor
- Customer Feedback Preferences
- Forward Your Emails into SogoConnect
- Email Forwarding and Monitoring Team
- Authenticate Email Domain
- Account Activity Log
- Define Dialogue Aging
- Create Tags in SoGoConnect
- Comparison in SogoConnect
- Raise a Dialogue
- Safelisting in SoGoConnect
- Critical Alerts: Set up Teams and Keywords
- Enable Browser-Based Notifications
- Critical Alerts
- Inbox
- Dialogues
- News
- SogoConnect Dashboard
- Campaigns
- Help
- Getting Started!
- Assessment Question types
- Score and more
- Quiz participation
- Get Results
While customer experience metrics like CSAT, CES, and NPS help you analyze satisfaction, effort, and loyalty, it’s very likely that your organization aspires to even more specific goals – professionalism, timeliness, quality – in an effort to provide your customers with an outstanding experience.
Customize your customer experience measurement and analysis by transforming important questions into CX metrics that can be tracked across your Tags and your Dashboard.
Here’s how:
-
- Create or open a CX project.
- Add a question that best represents a standard you’d like to measure – like service. The following question types are available:
- Rating Drop Down
- Rating Radio Button
- Rating Scale
- Smiley Rating Scale
- Symbol Rating (only single sub-question)
- Text box (Currency)
- Text box (Number)
- Text box (Percent)
- Once you have entered the question text and answer options, check ‘Set this question as a Custom Metric’.
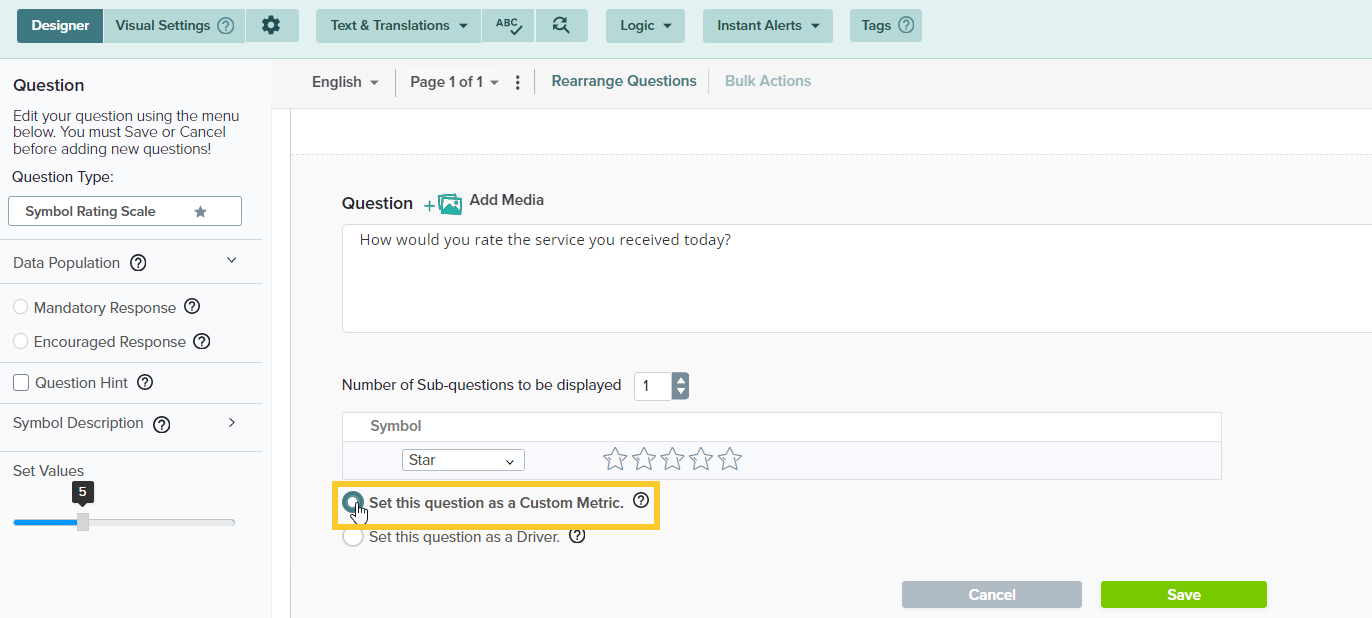
- Save your question.
- Next, on the pop-up, enter the details for your metric. Remember that your metric question will be displayed on the CX Dashboard under this name.
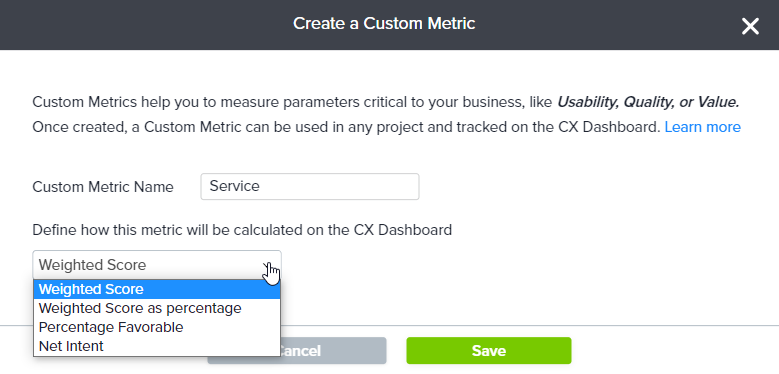
- Choose how would you like to calculate this metric on the CX Dashboard:
- Weighted Score: This score is calculated based on the weights assigned to each answer option.
- Weighted Score as Percentage: This percentage is calculated from weighted score divided by highest weight and multiplied by 100.
- Percentage Favorable: This percentage is based on the favorable responses divided by total responses and multiplied by 100.
For example:
On a 5 point scale, you might consider 4 and 5 as favorable. On a 10-point scale, you might set 7-10 as favorable, or 8-10. Your call. - Net Intent: Percentage of positive responses minus percentage of negative responses.
Once a Custom Metric is created, you will only be able to change its calculation on the CX Dashboard.
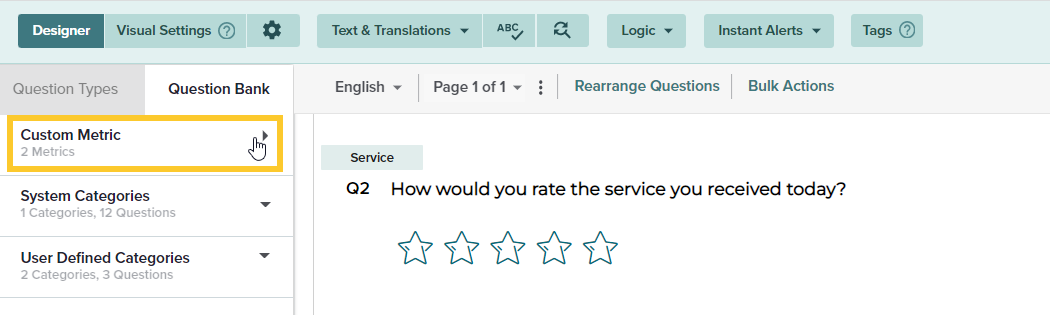
- Once set, the name of your Custom Metric will be displayed as a label on the question.
- All of your Custom Metric questions will be available within the Question Bank and can be reused across projects.
Learn more about adding Tags to your metric questions to analyze data on the CX Dashboard.
Default CX metrics (CSAT, NPS, CES) cannot be updated.
Learn more about Custom Metrics in the Dashboard.
Tags
Question TypesSubscribe for tips and insights to drive better decisions!
