- Getting Started!
- Building EX Surveys
- EX Metrics
- EX Dashboard
- EX Dashboard Settings
- Analyze your drivers
- Good to know
- Getting Started!
- Why Sogolytics
- Creation of Basic and Trial Accounts
- Creation of Paid Accounts
- Home Tab Tour
- Design Tab Tour
- Track Tab Tour
- Distribute Tab Tour
- Report Tab Tour
- Utilities
- Resource Hub
- Organizing Projects in Folders
- Intro to Premium Plan
- Intro to Pro Plan
- Intro to Free Trial Accounts
- Introduction to Free Basic Accounts
- Intro to Plus Plan
- Student, Academic, and Nonprofit Discounts
- Help Me Choose!
- Recent Projects
- Welcome Home
- All Projects
- Help Center
- Getting Started with Sogolytics
- Verify My Account
- Data Tab Tour
- Mobile App
- Design
- Question Types
- Add a Question
- Mobile Friendly Questions
- Introduction to Project Design
- Create a Project
- Re-use Questions and Answers
- Edit a Question
- Introduction to Simple Question Types
- Introduction to Grid Questions
- Horizontal Radio Button
- Question Bank
- Answer Library
- Import in Bulk
- Project Logic
- Single-Question Branching
- Multi-Question Branching
- Question Display Logic
- Answer Display Logic
- Advanced Design Options
- Piping
- Data Population
- Quota Management
- Link Responses to Directory
- Survey Page Actions
- Page Actions
- End and Exit on a Specific Page
- Bulk Actions
- Preview Page
- Project Tools
- Text & Translations
- Spell Check
- Find and Replace
- Rearrange Questions
- Question Sequence
- Preview Survey
- Introduction to Project Options
- Project Details
- Add Languages
- Anonymous Project
- Display Options
- Event Messages
- Save and Continue Later
- Thank You Message
- Reopen Submitted Responses
- URL Redirect: Static and Dynamic
- Print Options
- Expiry Rules
- Automatic Email Alerts
- Rules and Alerts
- Instant Thanks
- Question Features
- Formatting Questions
- Question Hint
- Mandatory Response
- Encouraged Response
- Answer Sequence
- Rearranging Answers
- Column Display
- Answer Option Sorting
- Question Tools
- Adding Images and Multimedia
- Bulk Actions
- Depositing to Question Bank
- Survey Branding
- Custom Survey URLs
- Custom Report URLs
- Add a Logo
- Introduction to Project Customization
- Customize Labels and Text
- Customize Project Style in Visual Settings
- Display Width
- Mobile Display Themes
- Hide Answer Options
- Edit an Active Survey
- Accessibility
- Copying Projects Between Accounts
- Download Project
- File Library
- Survey Design Pitfalls
- Build a Form
- Create with AI
- Use Template Bank
- International Survey Questions
- Project Types
- Switch Project Type
- Use Chain Invitations to Share Surveys
- IntelliMatrix
- Display Mode
- Enhanced Participation
- Descriptive Text
- Text Box
- Radio Button (Single-Select)
- Drop Down
- Check Box (Multi-Select)
- Demographic
- Rating Scale
- Symbol Rating Scale
- Like/Dislike
- Ranking
- Date
- Image Choice
- Net Promoter Score (NPS)
- Multiple Text Box
- Multiple Drop Down
- Radio Grid
- Check Box Grid
- Rating Radio Grid
- Rating Drop Down Grid
- Rating Scale Grid
- Matrix Grid
- Advanced Questions and Elements
- Page Break
- Captcha
- List Box
- Rating Drop Down
- Rating Radio Button
- Attachment
- Numeric Allocation
- Drill-Down
- Signature
- Answer Recommendations
- Distribute
- Directory
- Build Directory Using A File
- Build Directory Using External Sources
- Build Directory Using Project Responses
- Manage Directory
- Automation in Directory
- Introduction to Activities
- Creating Activities using a File
- Creating Activities using Project Responses
- Creating Activities using External Sources
- Introduction to Directories
- Participation
- Track
- Report
- Introduction
- Run a Report
- Verbatim: Open-Ended Text Analysis
- Response Table: Tabular Display of Responses
- Comparison: Compare Data Sets
- Frequency Table: Response Counts
- Statistical: Numeric Calculations
- Response Trend: Participation Over Time
- Response Rate: Participation By Group
- Attachment: Download Participant Files
- Advanced Frequency: Data Dive
- Segmentation Report: Divided Data
- Ballot Box Stuffing Report
- Omni All in One Report
- Display Options in Omni
- Applying Filters in Omni
- Overall Report Settings
- Survey Metadata
- Customize Card View
- Build Your Canvas
- Export Report and Canvas
- Individual Responses
- Mark Incomplete Responses Complete
- Exclude Response From Reports
- Export Individual Responses
- Edit Responses – Data Cleaning
- Charts and Graphs
- Customizing Charts
- Download/Export Charts
- Save, Export, Share Reports
- Save and Generate Reports
- Modify and Delete Reports
- Download Reports
- Email Dynamic Reports
- Share Reports
- Filter Manager
- Applying Filters
- Creating Filters
- Select Required Questions
- Download Formats Supported
- Net Promoter Score in Reports
- Calculating Averages
- Percent Doesn’t Add to 100%
- Merge Projects
- Save, Share and Slideshow
- Text Analysis: Measure Response Sentiment
- Engagement Report: Measure Engagement Scale
- Applying Segmentation to Questions in Omni
- Score in Omni
- Dimensional Analysis Report
- Cross Tabs in Omni
- Custom Dashboard
- Introduction to Widgets
- How to add a Widget?
- Graph Widget
- Table Widget
- Open-ended Responses Widget
- Description Widget
- Segmentation in Custom Dashboard
- Add Multiple Widgets
- Score Widget
- Dashboard Options
- Layout Settings
- Widget Settings
- Share Your Custom Dashboard
- How to Build a Custom Dashboard?
- Custom Dashboard Overview
- Filters in Custom Dashboard
- Introduction to Custom Dashboard
- Data & Security
- Import Options
- Import Offline Responses
- Import Sogolytics1 Format
- Export Data
- Export Automation
- Export Formats
- Export Data to SPSS
- Sogolytics1 Format for Import
- Export to MS Excel
- How do I exercise my GDPR rights?
- Right to Rectification
- Right to Erasure
- Right to Access your Data
- Rights for Participants
- Cookie Policy
- HIPAA Compliance
- HIPAA Features
- Enabling HIPAA Features
- Downgrading
- HIPAA Security Tips
- Integrations and API
- Google Analytics
- Overview
- Connect to Salesforce
- Push Data into Salesforce
- Create Contact Lists From Salesforce
- Good to Know
- API
- Zapier Integration
- Introduction to Automated Distribution
- Connect to Sogolytics SFTP server
- Create SFTP Folders and Files
- HTTP Targets
- Email to Invitation
- Add SFTP Folders and Files
- Connect to Sogolytics SFTP server
- Automated Distribution
- Dynamic Contact Lists: Google Drive
- Dynamic Contact Lists: OneDrive
- Dynamic Contact Lists: SFTP
- Account Administration
- Account Settings
- Update Personal Information
- Update Company Information
- Account Notifications
- Review Account Usage
- Sender Domain Authentication
- Customize Survey Labels
- Project Allocation
- Linked Account
- View Product Details
- Referral Program
- Payment History
- Billing Information
- Log Out From Sogolytics
- Your Account Logo
- YourCompany.com Survey URL
- Safelisting
- Introduction to User Management
- Adding Sub-Users
- User Management
- Workflow Management
- Project Calendar
- Know Your Limits
- Two-Step Authentication
- Account Security
- Survey Branding
- Good to Know
- Recent Account Activity
- Single Sign-On (SSO)
- Email Address Verification
- Use Your Mail Server
- Outbound Email Settings
- Dedicated Email Server
- Compliance
- DMARC Policy
- Billing
- Introduction
- Acceptable Payment Methods
- Upgrade a Paid Account
- Freeze Account
- Cancel Account
- Consider Before You Cancel
- Payment Receipts
- Change Billing Information
- Upgrade Using Purchase Order
- Referral Benefits Program
- Sogolytics Plans
- Payment Methods Available
- Failed Payment
- Switch to Annual Billing
- Upgrade a Basic/Trial Account
- Sign Up for a Paid Account
- Sogolytics Standard Support
- Downgrade or Cancel Account
- Poll Project
- Good to Know
- FAQs
- Getting Started!
- Building CX Surveys
- CX Metrics
- CX Dashboard
- CX Dashboard Settings
- Analyze your drivers
- Good to know
- Getting Started
- Account Set-up
- Account Administration
- Introduction to Account Administration
- Adding Users
- Edit User Information
- Permission Levels
- Add a User Group
- Edit a User Group
- Notes on User Groups
- Delete a User Group
- Building Landing Pages
- Enable Search on Landing Pages
- Where to Find Embed Codes for Landing Pages
- Tab Editor
- Customer Feedback Preferences
- Forward Your Emails into SogoConnect
- Email Forwarding and Monitoring Team
- Authenticate Email Domain
- Account Activity Log
- Define Dialogue Aging
- Create Tags in SoGoConnect
- Comparison in SogoConnect
- Raise a Dialogue
- Safelisting in SoGoConnect
- Critical Alerts: Set up Teams and Keywords
- Enable Browser-Based Notifications
- Critical Alerts
- Inbox
- Dialogues
- News
- SogoConnect Dashboard
- Campaigns
- Help
- Getting Started!
- Assessment Question types
- Score and more
- Quiz participation
- Get Results
The Sogolytics CX solution offers a powerful Dashboard designed to help you easily follow customer satisfaction trends and identify potential customer experience issues across the customer journey. The Dashboard gives you a bird’s eye view of your data so you can track real-time trends.
Here’s what you can see on the CX Dashboard:
Dashboard Overview
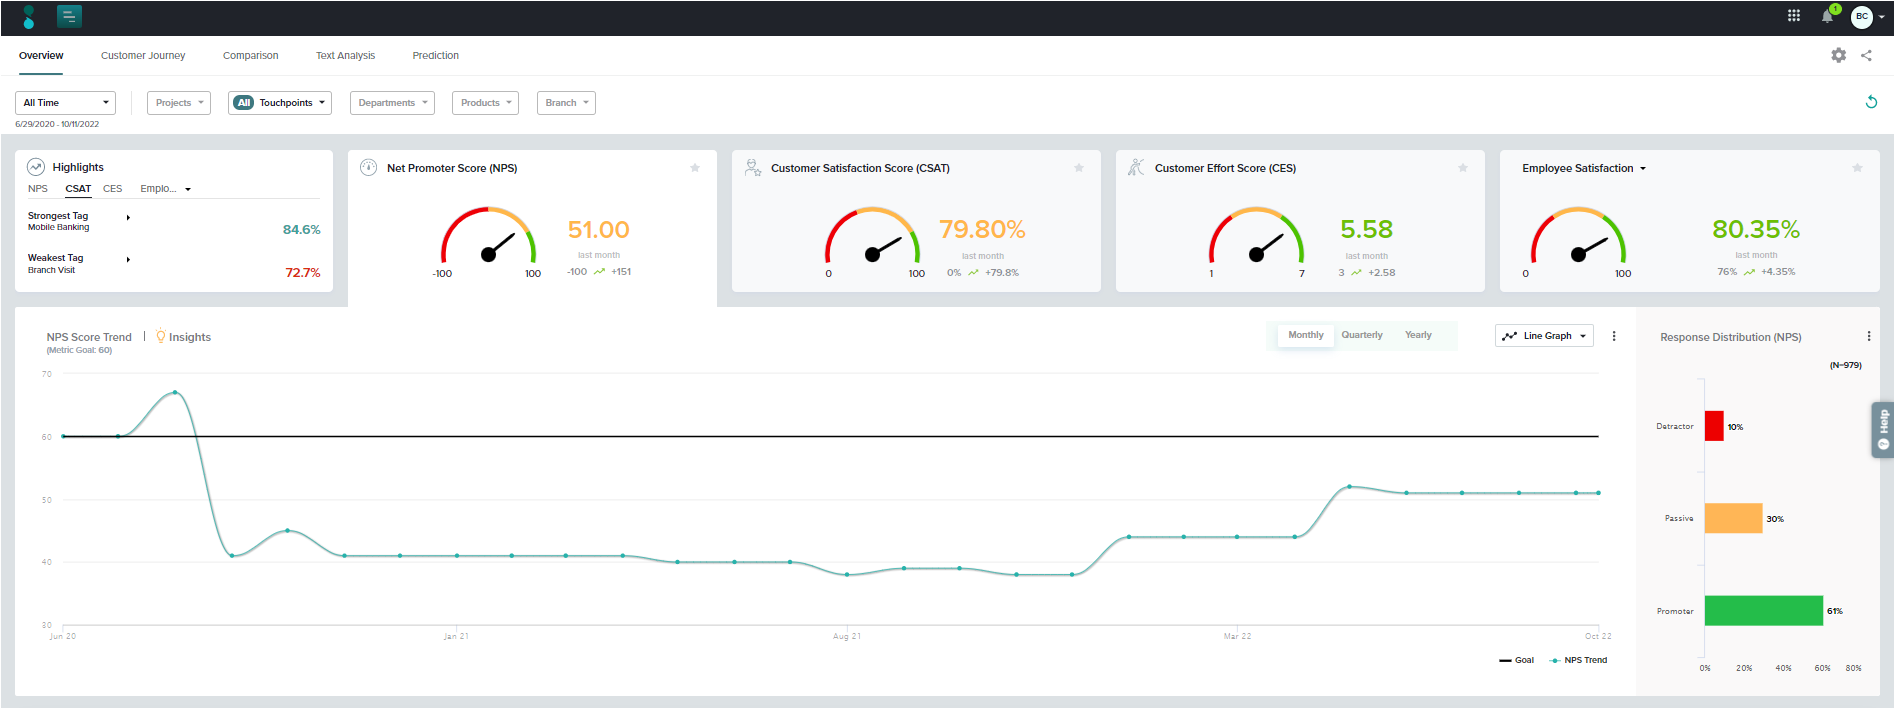
We provide three customer care metrics – NPS, CSAT, and CES – that offer a solid foundation for your CX study, but you may also create custom metrics to measure key elements specific to the experience of your own customers. By gathering and acting on this valuable feedback, you will be able to attract more customers, satisfy and retain existing customers, and make impactful moves right away and down the road.
The Dashboard Overview allows you to view key metric scores associated with all or selected Tags.
For a deeper understanding of what’s impacting the performance of your CX metrics across Tags, view the Insights section and drill down on key drivers. Understand which drivers matter the most to your customers and track their performance over time.
Learn more about the data analyzed under the Overview tab in the CX Dashboard.
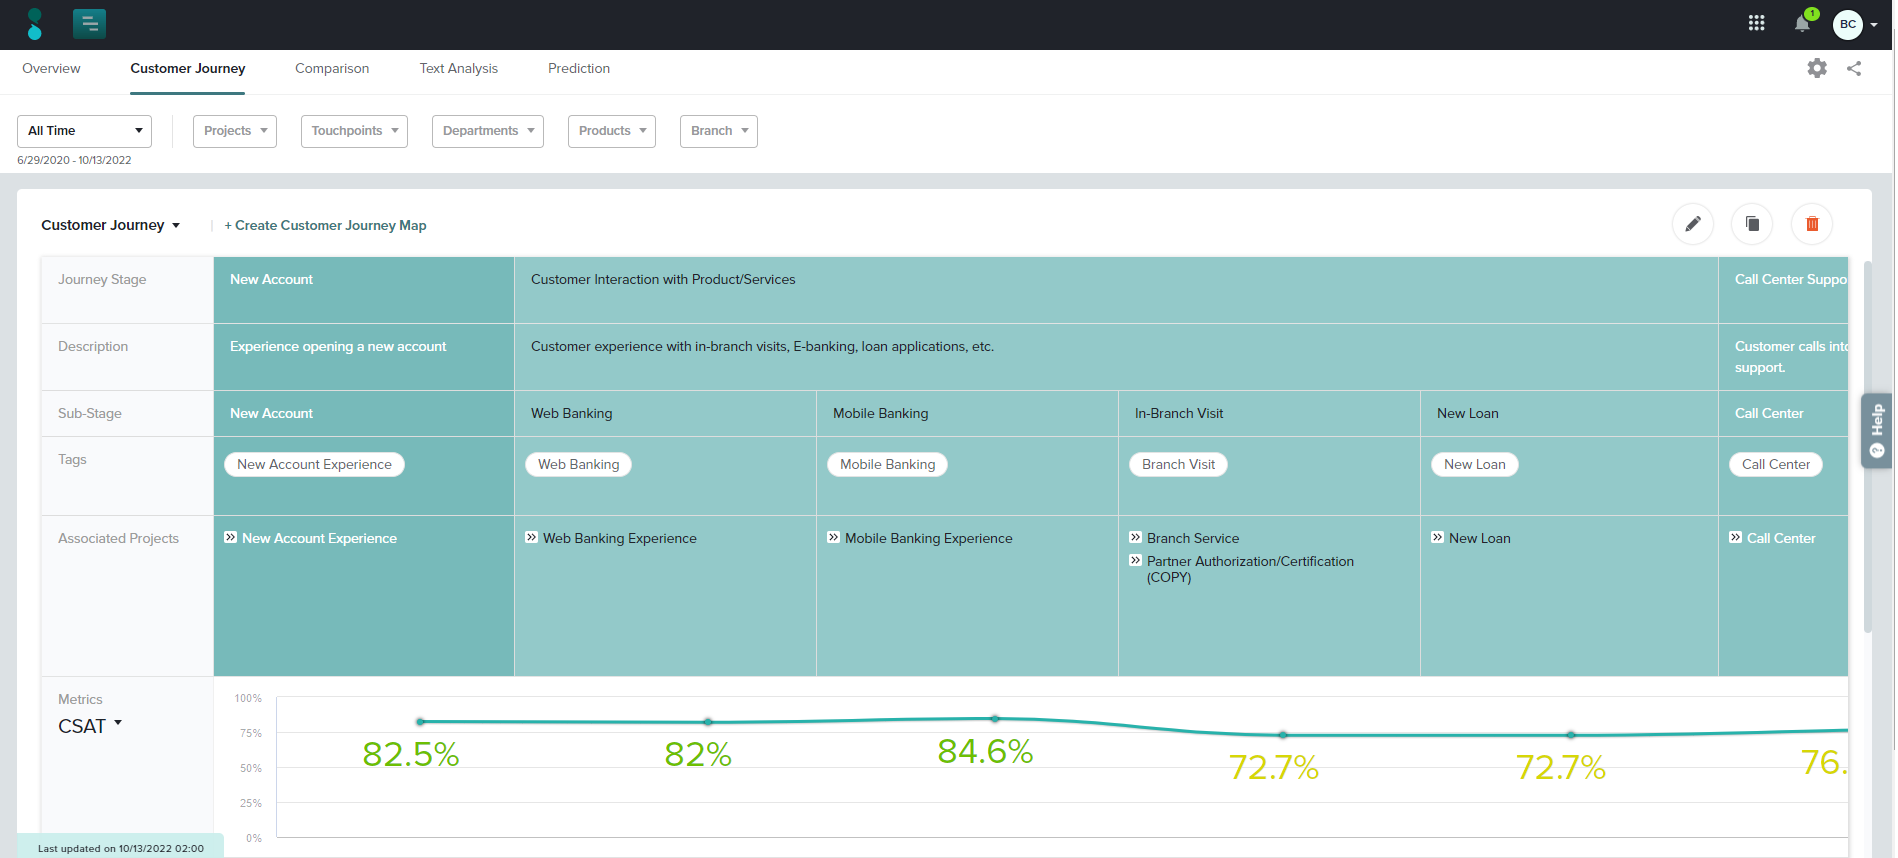
Customer Journey
This portion of the Dashboard helps you to map the satisfaction (and other metrics!) of your customers through various stages of their experiences with you. Drill down even more closely to view sub-stages, tracking experience across as many projects as needed. In the big picture, you may create multiple journeys for different groups of customers (those with home loans, those with checking accounts, etc.).
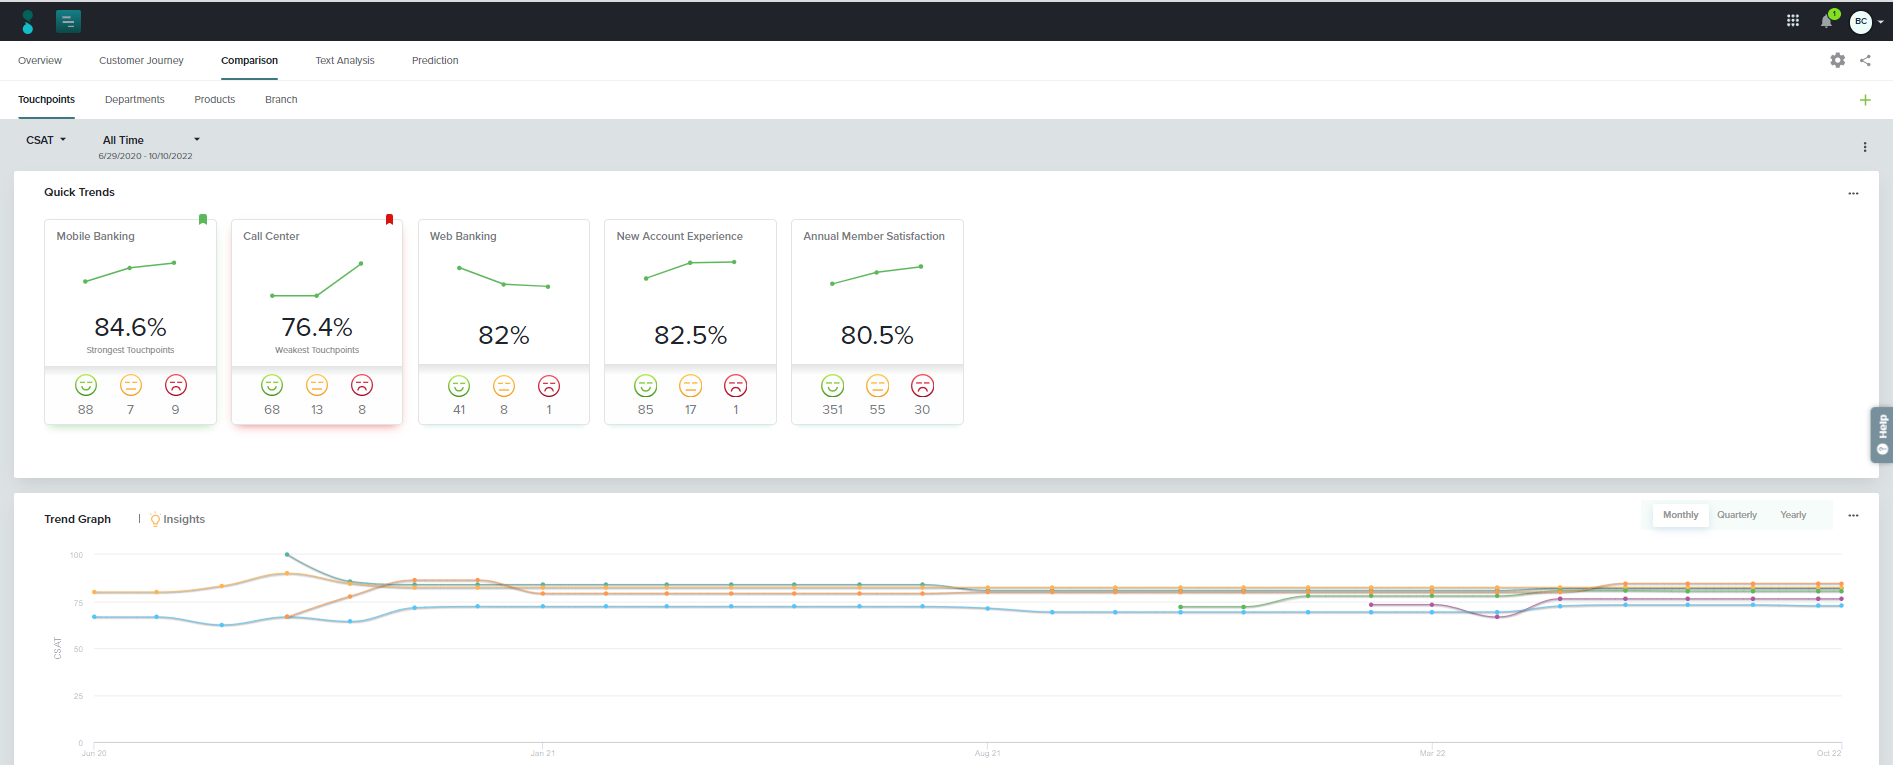
Comparison
Compare Tags within a single category or create your own comparison data sets. Compare scores and trends of different Tags across critical time periods.
To keep your team informed, it’s easy to share the Dashboard with a dynamic link that updates as responses are received.
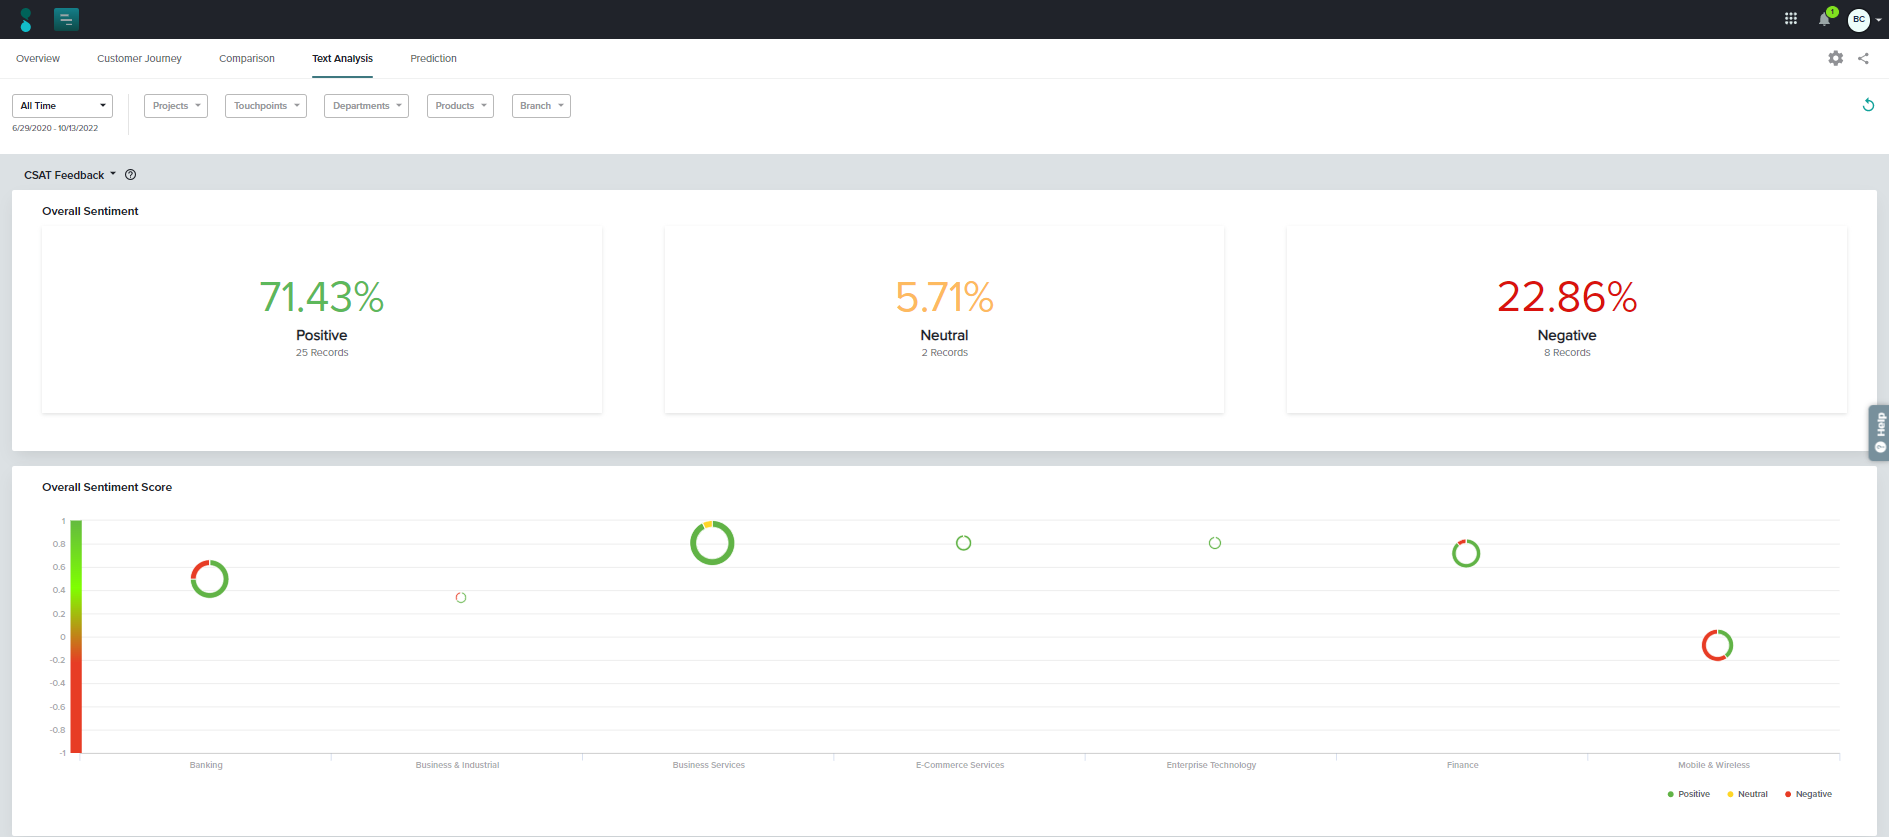
Text Analysis
Gauge the sentiments of customers’ open-ended responses, including Overall sentiment, sentiment graph, weekly sentiment score, and more. This section of the Dashboards analyzes content only from CX metric follow-up questions, so you can be sure that these are the most relevant explanations for the ratings displayed throughout the Dashboard.
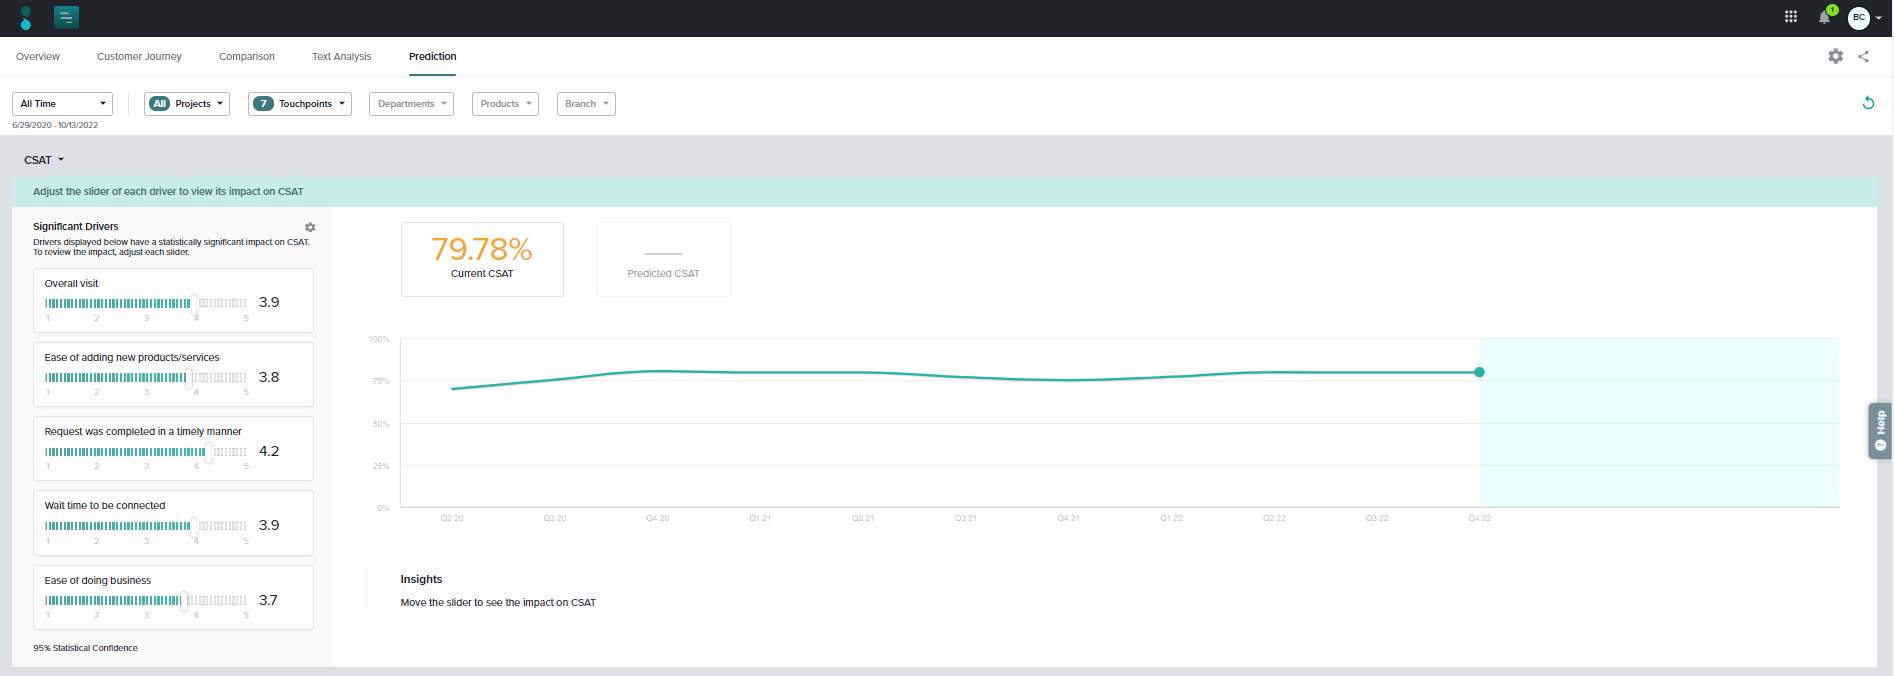
Prediction
Wondering where your time and resources can have the greatest impact? Predictive analysis allows you to test how improvements (or downgrades!) in statistically significant key drivers can impact your most important CX metrics.
Subscribe for tips and insights to drive better decisions!
