• Company
  • Sales  +1 (800) 646-0520
  • Contact Us
  • Login
Sogolytics – Online Survey Tool Sogolytics – Online Survey Tool Sogolytics – Online Survey Tool Sogolytics – Online Survey Tool
  • Products
    •  
      • Online Survey Tool (DIY)
        • Online Survey Tool (DIY)
        • Survey Design
        • Survey Distribution
        • Survey Participation
        • Reporting
        • Data Management
        • All Features
      • Enterprise Feedback
        • Enterprise Feedback
        • Take a Tour
        • Mobile App
        • Poll Maker
        • Form Builder
        • Assessment
      • Customer Experience
        • Customer Experience Overview
        • Omnichannel Experience
        • Voice of Customer
        • Customer Analytics
        • Ticketing
        • Customer Journey
        • Alerts and Action
    • span
      • Employee Experience
        • Employee Experience Overview
        • Employee Engagement
        • Employee Pulse
        • HR Analytics
      • Help Desk Ticketing
        • Help Desk Ticketing
        • Features
        • Closing the Loop
        • Use Cases
    •  
      • Security
      • Automation and Integration 
      • Managed Services
      • Survey Templates
      • Meet Sogolytics

        From design to distribution to data, our comprehensive solution is both intuitive and powerful.

  • Solutions
    • Solutions By Function
      • HR
      • Customer Service
      • Market Research
      • Consulting
      • Risk Assessment
      • Event Planning
      • Legal and Compliance
      • Resident Satisfaction
    • Solutions By Industry
        • Credit Union
        • Financial Services
        • Healthcare
        • Government
        • Travel & Hospitality
        • K12
        • Higher Education
        • B2B
        • Non-Profit
        • Technology
        • B2C
        • Retail
        • Airlines
        • Automotive
        • Manufacturing
    •  
      • Security

        Our top-tier certifications and practices ensure your data privacy and security every step of the way.

      • Survey Templates

        Professionally designed questionnaires for a wide range of projects allow you to go live in no time.

    •  
      • Customized Success

        Our powerful, flexible solutions serve clients across industries and around the world. Their success is our success.

      • See Case Studies
  • Pricing
      • Online Survey Tool
        SogoSurvey

        Enabling individuals and small teams to create and manage professional-looking surveys, forms, and polls.

        Learn more
      • Enterprise Feedback
        SogoCore

        Empowering businesses to gather and analyze feedback through a comprehensive platform that supports secure collaboration.

        Learn more
      • Customer Experience
        SogoCX

        Enabling companies to improve customer experience and loyalty by examining trends and drivers across the customer journey.

        Learn more
      • Help Desk Ticketing
        SogoConnect

        Transforming always-on feedback collection into a streamlined triage and follow-up flow to close the loop efficiently.

        Learn more
      • Employee Experience
        SogoEX

        Helping organizations to listen more deeply to their employees to uncover key drivers that impact engagement and retention.

        Learn more
  • Pricing
    • SogoSurvey
    • SogoCore
    • SogoCX
    • SogoConnect
    • SogoEx
  • Pricing
  • Customers
  • Resources
    •  
      • User Guide
      • Video Library
      • Training
      • Latest Release
    •  
      • Blog
      • Webinars
      • Templates
  • Sign Up Free Sign Up Free
  • Request a Demo Request a Demo
Sogolytics Blog Sogolytics Blog Sogolytics Blog Sogolytics Blog
Sogolytics Blog Sogolytics Blog
  • Products
    •  
      • Online Survey Tool (DIY)
        • Online Survey Tool (DIY)
        • Survey Design
        • Survey Distribution
        • Survey Participation
        • Reporting
        • Data Management
        • All Features
      • Enterprise Feedback
        • Enterprise Feedback
        • Take a Tour
        • Mobile App
        • Poll Maker
        • Form Builder
        • Assessment
      • Customer Experience
        • Customer Experience Overview
        • Omnichannel Experience
        • Voice of Customer
        • Customer Analytics
        • Ticketing
        • Customer Journey
        • Alerts and Action
    • span
      • Employee Experience
        • Employee Experience Overview
        • Employee Engagement
        • Employee Pulse
        • HR Analytics
      • Help Desk Ticketing
        • Help Desk Ticketing
        • Features
        • Closing the Loop
        • Use Cases
    •  
      • Security
      • Automation and Integration 
      • Managed Services
      • Survey Templates
      • Meet Sogolytics

        From design to distribution to data, our comprehensive solution is both intuitive and powerful.

  • Solutions
    • Solutions By Function
      • HR
      • Customer Service
      • Market Research
      • Consulting
      • Risk Assessment
      • Event Planning
      • Legal and Compliance
      • Resident Satisfaction
    • Solutions By Industry
        • Credit Union
        • Financial Services
        • Healthcare
        • Government
        • Travel & Hospitality
        • K12
        • Higher Education
        • B2B
        • Non-Profit
        • Technology
        • B2C
        • Retail
        • Airlines
        • Automotive
        • Manufacturing
    •  
      • Security

        Our top-tier certifications and practices ensure your data privacy and security every step of the way.

      • Survey Templates

        Professionally designed questionnaires for a wide range of projects allow you to go live in no time.

    •  
      • Customized Success

        Our powerful, flexible solutions serve clients across industries and around the world. Their success is our success.

      • See Case Studies
  • Pricing
      • Online Survey Tool
        SogoSurvey

        Enabling individuals and small teams to create and manage professional-looking surveys, forms, and polls.

        Learn more
      • Enterprise Feedback
        SogoCore

        Empowering businesses to gather and analyze feedback through a comprehensive platform that supports secure collaboration.

        Learn more
      • Customer Experience
        SogoCX

        Enabling companies to improve customer experience and loyalty by examining trends and drivers across the customer journey.

        Learn more
      • Help Desk Ticketing
        SogoConnect

        Transforming always-on feedback collection into a streamlined triage and follow-up flow to close the loop efficiently.

        Learn more
      • Employee Experience
        SogoEX

        Helping organizations to listen more deeply to their employees to uncover key drivers that impact engagement and retention.

        Learn more
  • Pricing
    • SogoSurvey
    • SogoCore
    • SogoCX
    • SogoConnect
    • SogoEx
  • Pricing
  • Customers
  • Resources
    •  
      • User Guide
      • Video Library
      • Training
      • Latest Release
    •  
      • Blog
      • Webinars
      • Templates
  • Sign Up Free Sign Up Free
  • Request a Demo Request a Demo
Last updated on: Nov 19, 2020

Cross-Tabulating Survey Data to Increase Your Rate of “Aha!” and “Oh Wow!”

by Hamid Farooqui

Estimated Reading Time : 4 mins

One powerful way to gain insight from your surveys is to cross-tabulate the data. Doing so lets you discover correlations that aren’t obvious from a basic report.

“Say you were standing with one foot in the oven and one foot in an ice bucket,” said Bobby Bragan. “According to the percentage people, you should be perfectly comfortable.”

Basic survey reports can provide overall knowledge: this percentage of users is satisfied with their customer support resolution, or that percentage rank our product as best-in-class. But so much valuable information can be buried in the details!

For instance, your customers in the southeast might be thrilled with their purchase experience, but people in the northeast could have a horrible rating. If that were the case, you’d want to investigate what’s going wrong in the northeast region, instead of mistakenly working on the assumption that people are happy overall.

One way to analyze your survey data in more depth is to cross-tabulate it. That is, you compare the results in a table that shows the answers to more than one question. Even if you are new to conducting surveys and analyzing the data, you surely are familiar with the concept from basic spreadsheet use:

Item sold Northeast Southeast Northwest Southwest Total
Turbo widget 14 6 25 12 57
Basic widget 16 73 25 6 120
Enterprise widget 52 11 5 34 102
Total 82 90 55 52 279

So: Cross-tabulation – available in Sogolytics Plus and above – lets you look at survey results in a similar way, by breaking down the information based on categories established from other questions’ answers. Here’s an introduction to how it works.

Let’s say you’re trying to decide whether your company should hold an in-person conference. It’s a no-brainer to ask customers about their interest, to find out how long they’d expect such an event to last, and to learn which locations are most appealing.

The overall results are the most important; if only 10% would show up for a conference, the details are a moot point. However, it is likely that you care most intensely about the preferences of the people who say, “I absolutely would attend!” because they’re most committed to the event.

Thus, to use a simple example, you want to end up with a table that cross-tabulates customers’ attendance plans with the expected event length. In this case, there’s a correlation between attendance plans and how long the conference lasts. With “enough” attendees, you can justify a two-day event rather than a single day.

At least, it works as a good “how to” for the process of creating a simple cross-tabulation report.

Simple Cross Tabulation Report - Sogolytics

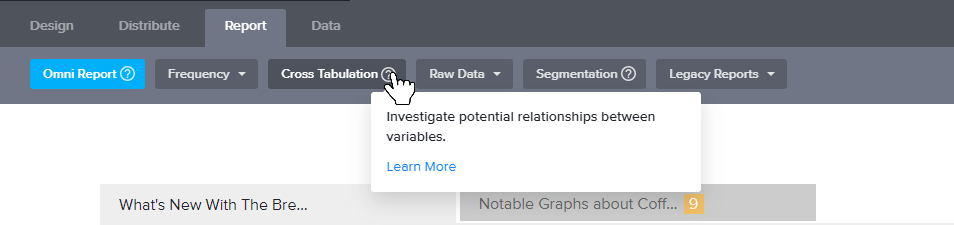
From the main Sogolytics page, choose Reports, then select the survey to analyze. From the drop-down menu select Cross Tabulation.

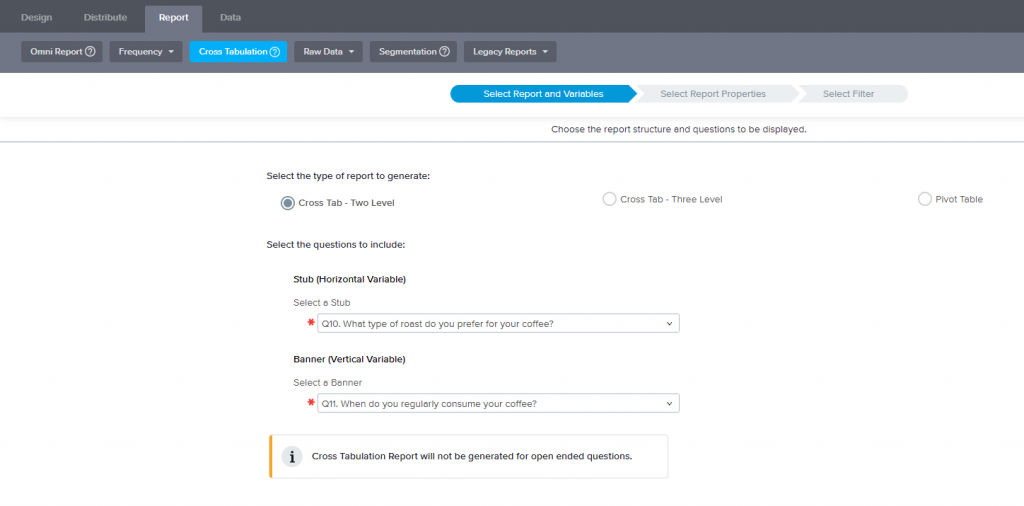
The first step in the three-step process is to identify which two questions Sogolytics should use in the comparison. You can choose any question type except open-ended text. (It’s possible to compare three questions, but I’m keeping it simple.)

Choose Next to set the next set of options. Or you can jump to the results and take the default settings for the report. That’s useful when you’re poking at the numbers to determine for yourself if there’s a correlation; if the results generate an “Aha!” you can go back to optimize the report before you share it with other people.

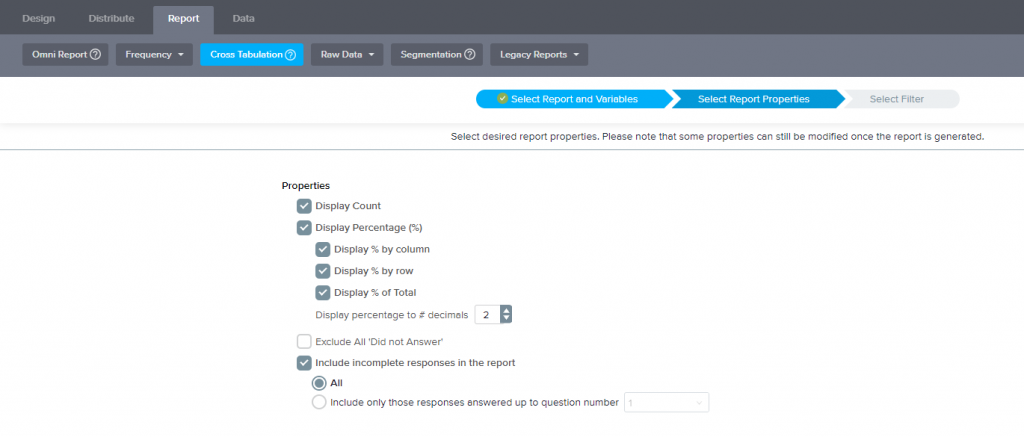
The cross tab report can show data as percentages (34%), number of responses (18 said yes), or both. You can also decide whether to include categories for “did not answer” (which sometimes is meaningful, but also may be a distraction). You optionally can include survey data for respondents who did not complete the survey.

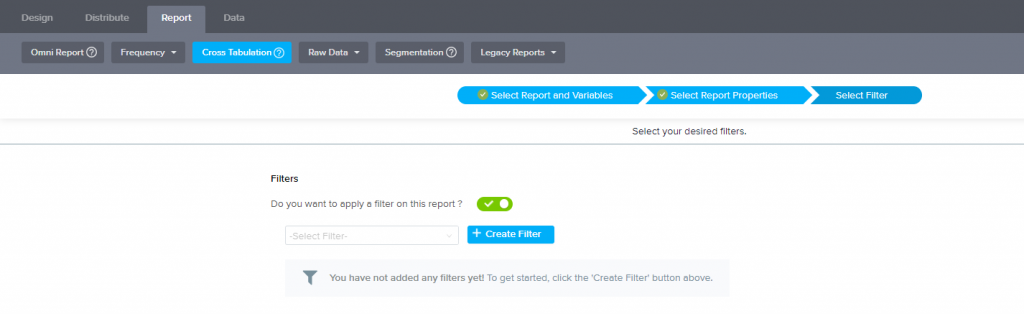
You can filter the data beyond the overall comparison. For this example, that might matter if  you care whether the enthusiastic event respondents’ opinions are affected by their geography. So you might limit the cross tabulation report to customers who live only in the northeast, since you’re already sort-of-planning to hold the conference in Washington DC.

…And there’s a report! If you stick with the defaults, the displayed report might have more than you need to see; sometimes it’s confusing to see all those “percents.” But you can turn options on-and-off in the Report Properties section at the top of the screen to further refine what’s shown – including a stacked vertical or stacked horizontal graph.

Survey Cross Tabulation Report - Sogolytics

Assuming that the cross- tabulation gives you some level of enlightenment – I admit this one is more illustrative than exciting – you may want to share the results with other people. Sogolytics makes that easy, permitting you to email the report or to save the file as a Word or Excel file.

You can do more with cross-tabulation, such as adding another question to the comparison. But I think this shows adequately how the feature works, and I hope it inspires you to experiment a little more with your data analysis.

SHARE:
Categories
Best Practices Feature Focus

Tags:

customer surveydesign surveyonline surveySogolyticssurvey featuressurvey reports
Write for Us
Everyone has a story — and many of us have lots of stories! Share your experience and expertise with our community as we all learn and grow together.
Know More

Recent Posts

  • 31.8 Sogolytics Sprint Release Highlights July 5, 2024
  • Testing adding more categories April 17, 2024
  • How to Improve Employee Engagement and Retention: Study Results March 14, 2024
  • How to invest in real estate for beginners and maximize your return February 2, 2024
  • Time to Win! October 11, 2023
Love it when you know more?

Subscribe for tips, tricks, and insights to drive better decisions!

completed tick icon
Thank you!
Your request has been successfully submitted.
cross-tabulating-survey-data-to-increase-your-rate-of-aha-and-oh-wow

Download the app for free:

QUICK LINKS

  • Online Survey Tool (DIY)
  • Enterprise Survey Software
  • Customer Experience (CX) Platform
  • Employee Experience (EX) Platform
  • Customer Feedback Management
  • Automation and Integrations
  • Managed Services

COMPANY

  • About Us
  • Blog
  • Careers
  • Contact Us
  • Newsroom
  • Our Customers
  • Sitemap

RESOURCES

  • Help
  • Training Videos
  • Sample Surveys
  • Webinars
  • Request a Demo
  • Create Surveys
  • Quiz Maker

CONTACT

2291 Wood Oak Drive
Suite 300 Herndon, VA 20171
+1 (800) 646-0520
support1@sogolytics.com
Copyright 2025 Sogolytics. All rights reserved.
  • Privacy Policy
  • Terms of Service
  • Anti-Spam Policy
  • Data & Security
SoGoSurvey – Online Survey Tool
This site uses cookies: Find out more.